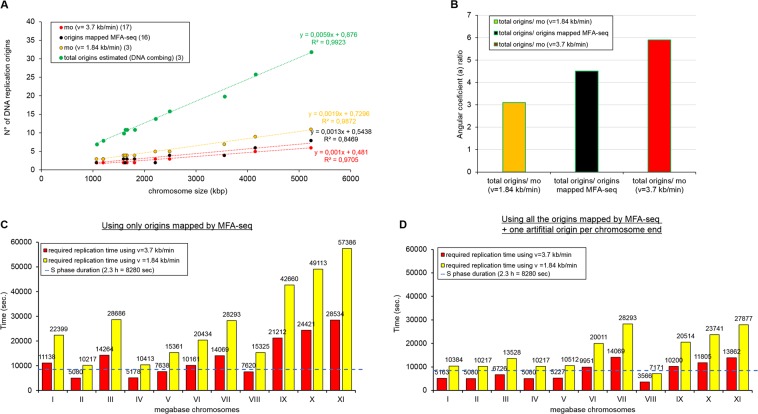
Figure 2.
The constitutive origins mapped in T. brucei are not enough to accomplish the complete DNA replication within S-phase duration. (A) Graph showing positive correlations between chromosome length and the number of replication origins estimated by DNA combing (total origins) (green dots), number of origins estimated by MFA-seq (black dots), minimum origins (mo) estimated using v = 3.7 kb.min−1 (red dots), and mo estimated using v = 1.84 kb.min−1 (yellow dots). The trend lines for all groups, as well as the equations, are shown. (B) Angular coefficient ratios between total origins and mo using v = 1.84 kb.min−1 (yellow bar = 3.1), total origins and origins estimated by MFA-seq (black bar = 4.5), and total origins and mo using v = 3.7 kb.min−1 (red bar = 5.9). (C) Minimum time required for each T. brucei chromosome to complete DNA replication according to the positions of the origins mapped by MFA-seq (16), using two different values for the replication rate: v = 3.7 kb.min−1 (red) or v = 1.84 kb.min−1 (yellow). The dashed line represents the estimated S-phase duration reported in this study. (D) To resolve the bias generated by the possible presence of origins hidden in subtelomeric/telomeric regions, we repeated the assay shown in C by adding an artificial origin per chromosome end. Of note, each origin was localized 50 kb upstream of the chromosome end.

