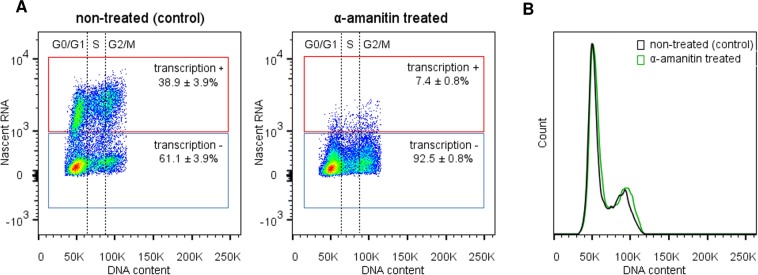
Figure 4.
Transcription landscape throughout the T. brucei cell cycle. (A) Density plot showing the distribution of the population according to DNA content and nascent RNA synthesis. Left – Non-treated (control) population showing transcriptional activity (nascent RNA) = 38.9 ± 3.9% (red square). Right – After transcription inhibition using α-amanitin, nascent RNA decreased to 7.4 ± 0.8% (red square). The cell cycle phases (G0/G1, S, and G2/M) are indicated. Red square – transcription-positive, blue square – transcription-negative. (B) Histograms show virtually unchanged DNA content profiles for the control (black line) and α-amanitin treated groups (green line). These assays were carried out in biological triplicate, and 20,000 parasites (n = 20,000) were counted in each analysis.

