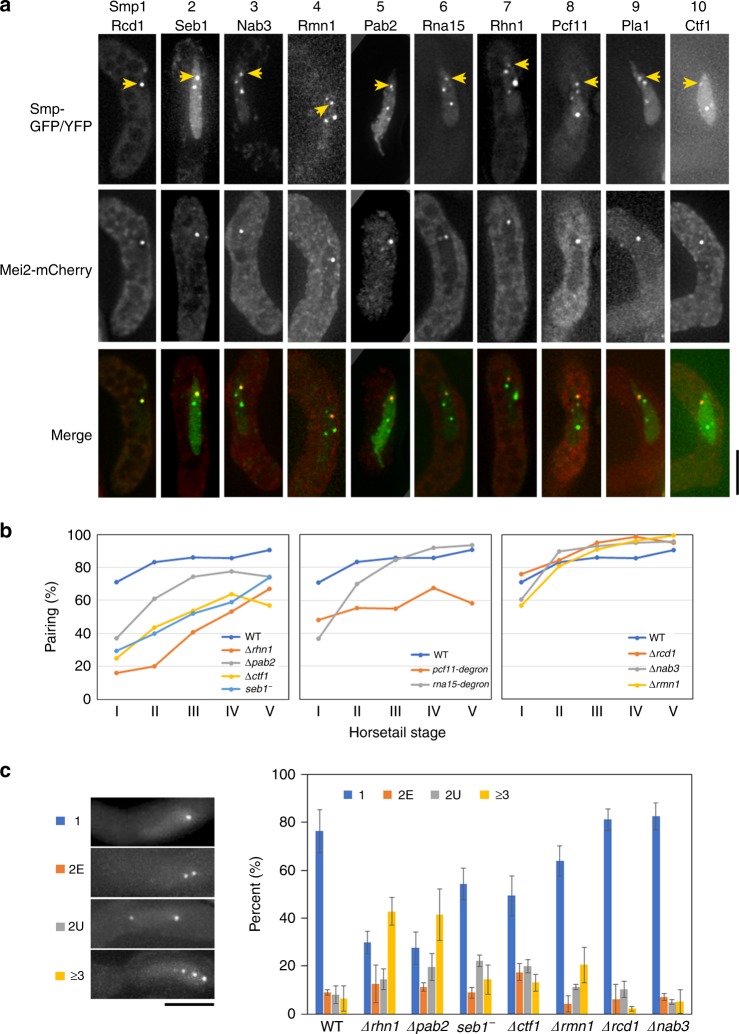
Fig. 1.
Smp proteins are required for robust pairing at the sme2 locus. a Localization of Smp1–Smp10 proteins fused with GFP or YFP in the horsetail nucleus. Arrows indicate co-localization with Mei2-mCherry. Meiosis was induced in the homothallic strains expressing YFP-fused or GFP-fused Smp protein and Mei2-mCherry. Three-dimensional fluorescence images of YFP/GFP and mCherry were acquired in live zygotes. Yellow arrows indicate the position of Smp protein co-localized with Mei2 at the sme2 locus. Scale bar, 5 μm. b Pairing frequency (%) of the sme2 locus in wild type (WT) and various defective mutants of Smp proteins: Δrhn1, Δpab2, Δctf1, seb1-E38, pcf11-degron, rna15-degron, Δrcd1, Δnab3, and Δrmn1. The number of cells examined is provided in a Source Data file 1b. Characterization of the pcf11-degron, rna15-degron, and seb1-E38 mutants, is shown in Supplementary Fig. 2. Cells of all the strains were induced to meiosis at 26 °C. The sme2 loci at distance ≤0.35 μm were counted as paired, and pairing frequencies were plotted for five substages (I–V) of the horsetail stage. Percentile rank plots of the distance between homologous loci are shown in Supplementary Fig. 3. Source data for Fig. 1b and Supplementary Fig. 3 are provided as a Source Data file 1b. c Frequency (%) of the number of sme2 RNA dots in WT and various Smp-defective mutant cells at the horsetail stage. The RNA dots were classified into four classes (1 for a single dot, 2E for 2 RNA dots with equal size, 2U for 2 RNA dots with unequal size, and >3 for more than 2 dots). Representative images for one to three or more dots are shown on the left. Two dots with equal size (2E) or unequal size (2U) were counted separately. Class 2E likely represents sme2 RNA accumulated at each of the homologous sme2 loci. More than 60 horsetail nuclei in an asynchronous population were observed for each strain, in three independent experiments; the precise number of cells examined is provided in a Source Data file 1c. Error bars indicate standard deviation. Scale bar, 5 μm. Source data for Fig. 1c are provided as a Source Data file 1c.

