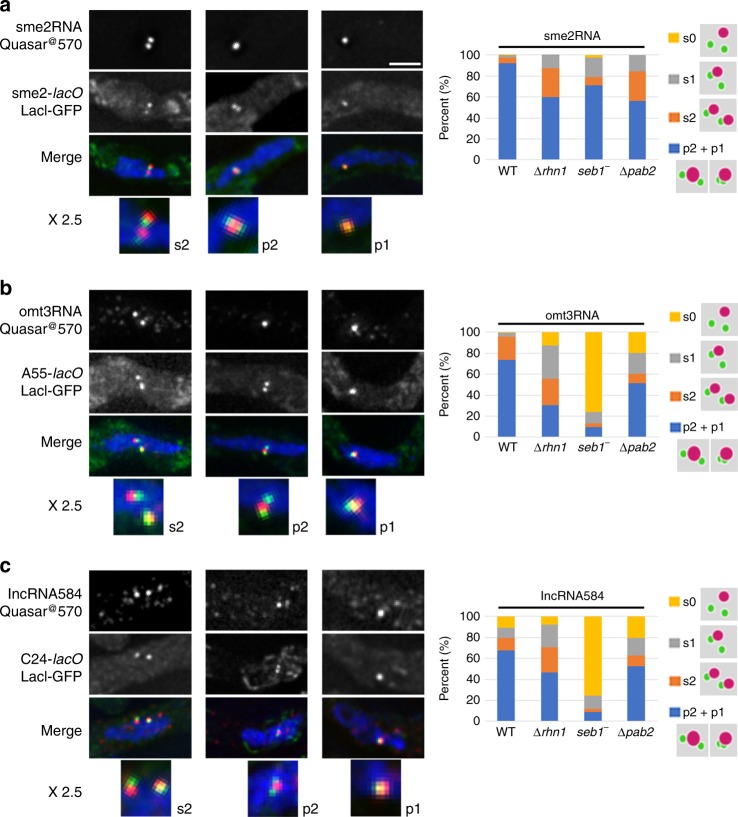
Fig. 3.
Localization of lncRNA on homologous chromosome loci. (Left) smFISH analysis for sme2 RNA (a), omt3 RNA (b), and lncRNA584 (c) using sequence-specific probes labeled with Quasar®570. Chromosomal loci were visualized using lacO/LacI-GFP. DNA was visualized using 4′,6-diamidino-2-phenylindole. In the merged images, smFISH is shown in red, lacO/LacI-GFP in green, and DNA in blue. Enlarged images (×2.5) are shown at the bottom. The abbreviations are as follows: s2: two separate RNA dots, each associated with a LacI-GFP dot, p2: a single RNA dot between two juxtaposed LacI-GFP dots, and p1: a single RNA dot with a paired LacI-GFP dot. Scale bar, 2 μm. (Right) Signal patterns of smFISH counted (n > 100 for each sample) in WT, rhn1 deletion mutant (Δrhn1), seb1-E38 mutant (seb1−), and pab2 deletion (Δpab2) mutant. p2 and p1 (blue) and s2 (orange) are defined above. s1 (gray): two separate LacI-GFP dots, only one of which is associated with an RNA dot. s0 (yellow): two separate LacI-GFP dots, none of which is associated with an RNA dot. Source data for Fig. 3 are provided as a Source Data file 3.

