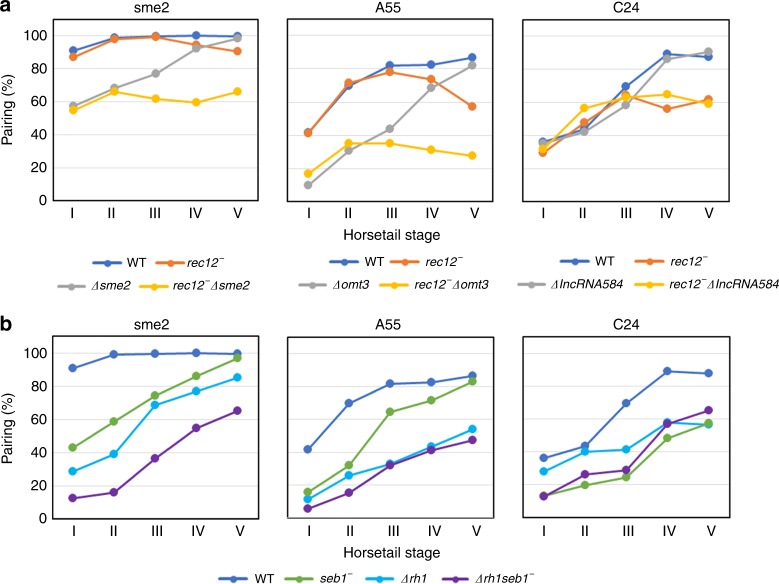
Fig. 4.
Homologous chromosome pairing at lncRNA accumulation sites. a, b Pairing frequencies were plotted for five substages (I–V). Pairing frequency (%) at the sme2, A55, and C24 loci in WT (blue), rec12− (orange), Δsme2, Δomt3, and ΔlncRNA584 (gray), Δsme2 rec12−, Δomt3 rec12−, and ΔncRNA.584 rec12− (yellow) Δrhn1 (light blue), seb1− (green), and Δrhn1 seb1− double mutants (purple) was measured in 18–53 cells for each strain; the precise number of cells examined for each strain is provided in Source Data file 4. Percentile rank plots of the distance between homologous loci are shown in Supplementary Fig. 5. Source data for Fig. 4 and Supplementary Fig. 5 and are provided as a Source Data file 4.

