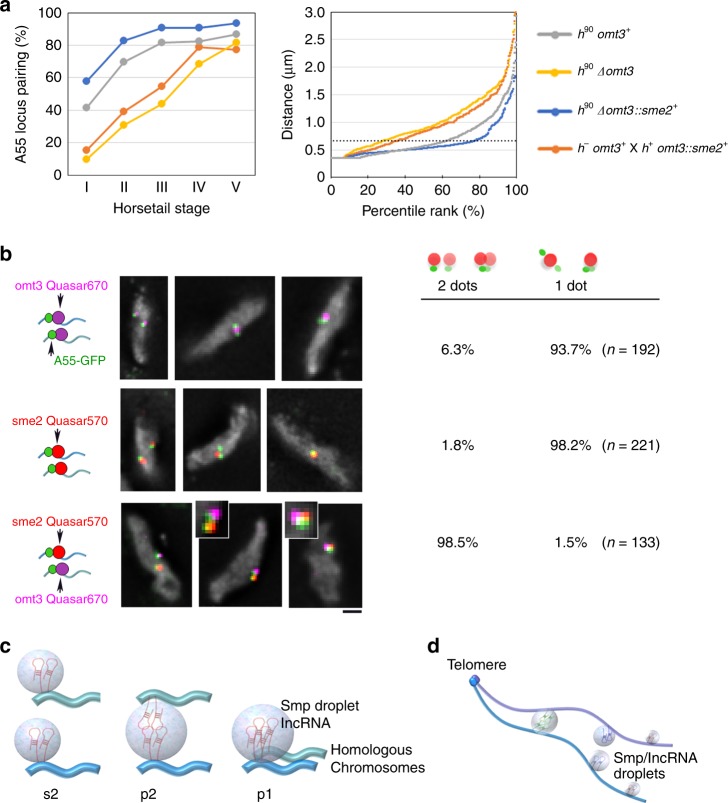
Fig. 6.
Specificity for the recognition of homologous loci. a Pairing frequency at the A55 locus in h90 homozygous zygote cells (left panel): wild type (gray), Δomt3 (yellow), replacement of omt3 with sme2 (Δomt3::sme2+, blue); and in heterozygous zygote cells from a wild type h−omt3+ crossed with a h+ Δomt3::sme2+ strain (orange). Right panel shows percentile rank plots of the distance between the A55 loci in the first three substages. The dotted line at 0.67 μm on the Y-axis indicates the threshold of pairing. The authentic sme2 gene was deleted in h90 Δomt3::sme2+ cells, and in the heterozygous crossed zygote cells. Source data for Fig. 6 are provided as a Source Data file 6. b smFISH analysis for omt3 RNA (probes labeled with Quasar®670, purple) and sme2 RNA (probes labeled with Quasar®570, red) for the strain combinations shown in a. Chromosomal loci were visualized using lacO/LacI-GFP (green). DNA was visualized using DAPI. Typical smFISH images in the horsetail nuclei are shown on the left; the bar represents 1 μm. On the left column, a summary of two categories of staining is shown: two GFP dots each with an RNA dot, separated from each other by <0.67 μm; or a paired GFP dot with one RNA dot. Number of horsetail nuclei examined are shown in the parentheses. c Schematic representation of the pairing of homologous loci in this study. Blue lines represent chromosomes and light blue spheres represent RNA bodies containing Smp proteins and lncRNAs. The s2, p2, and p1 states are defined as in Fig. 3. d The model of chromosome pairing. Blue and purple lines represent a set of homologous chromosomes held together at the telomeres. Spheres represent liquid droplets containing Smp proteins and lncRNAs. Arrays of phase-separated Smp/lncRNA droplets align due to telomere clustering. The homologous droplets fuse together upon contact, promoting the pairing of homologous chromosomes.

