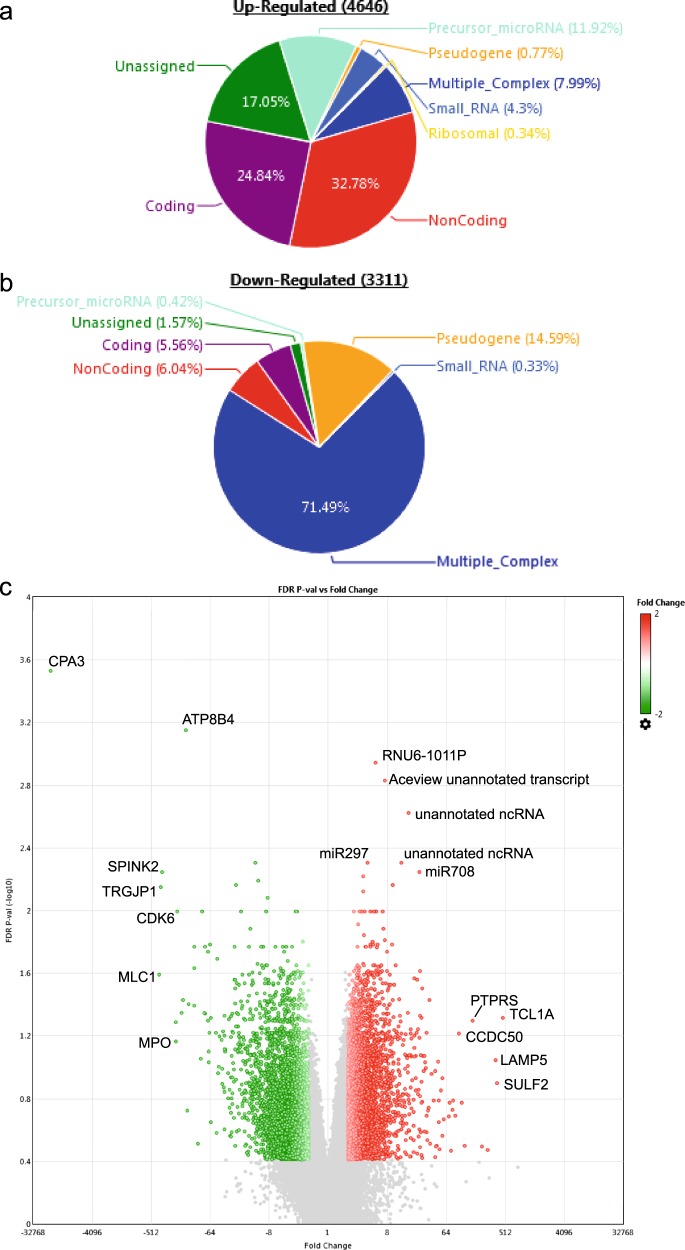
Fig. 2. Differential gene expression in BPDCN (N = 6) as compared with TET2-mutated AML (AMLTET2) (N = 7).
Pie charts of the type of transcripts upregulated (a) or downregulated (b) in BPDCN as compared with AMLTET2. Coding: transcript results in a protein. Noncoding: transcript does not result in a protein. Pseudogene: transcript may not be expressed and if expressed, does not produce a functional protein. Precursor-microRNA: unprocessed, premature microRNA. Unassigned: uncharacterized transcript. Multiple_Complex: fits into multiple categories of the above. c Volcano plot showing the genes that are differentially expressed between BPDCN and AMLTET2. The genes in red (upregulated in BPDCN) and green (downregulated in BPDCN) are at fold changes −4 > x > 4, with FDR F-test adjusted P < 0.03.

