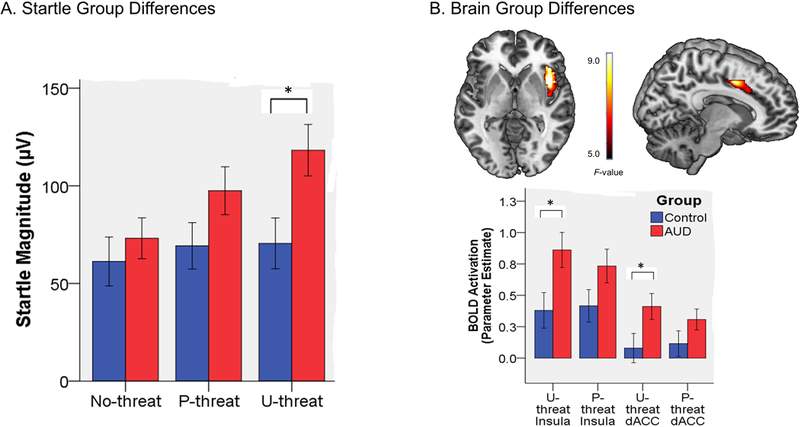
Fig. 1.

(A.) Bar graph illustrating group differences in startle magnitude during the no-threat, predictable threat (P-threat), and unpredictable threat (U-threat) task conditions. Bars reflect standard error. (B.) Top depicts voxel-wise statistical F-maps on a canonical brain displaying significant group differences within the Anticipatory Anxiety Network (AAN) during threat > no-threat at pcorrected < .05. Bottom reflects extracted parameter estimates of insula and dorsal anterior cingulate cortex (dACC) activation during both predictable (P-threat) and unpredictable (U-threat) threat. Bars reflect standard error.
