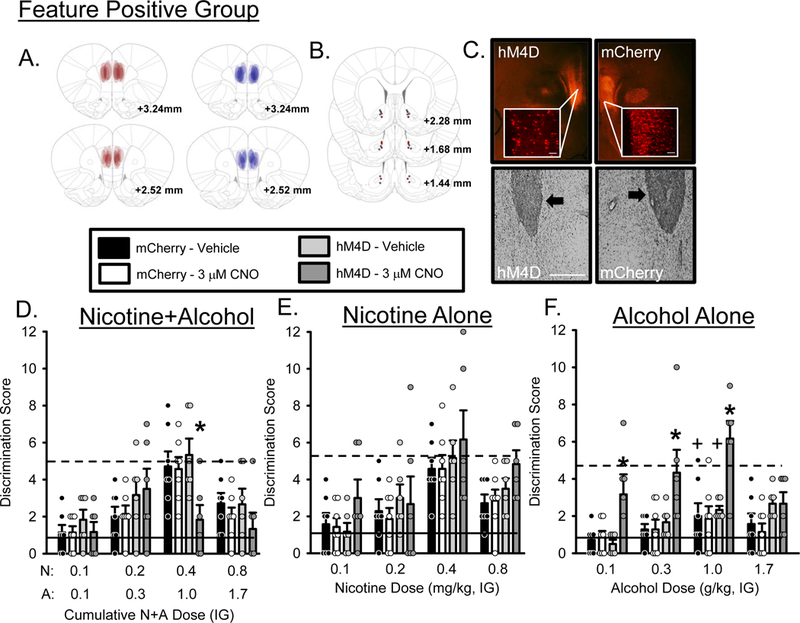
Figure 3.

Substitution curves for the Feature Positive group following mPFC-PL→AcbC silencing. N = 6 for the hM4D group and n = 7 for the mCherry control group. (A) Representative expression maps for hM4D (red) and mCherry (blue), (B) cannulae placements for hM4D (red dots) and mCherry (blue dots) and (C) representative photomicrographs showing representative DREADD and mCherry (top panels, 2X and 20X images, scale bar is 1000 µm) and cannula placements (bottom panels, arrows indicate position of AcbC injector). (D) Mean(+S.E.M.) discrimination score (head entries during the single 15-s light CS minus head entries during 15 seconds before light onset) for the N+A substitution test. CNO significantly decreased discrimination score at the training dose (0.4N/1.0A) compared to vehicle and the mCherry control group suggesting that mPFC→AcbC projections are important for modulating sensitivity to N+A. (E) Mean(+S.E.M.) discrimination score for the nicotine only substitution test. (F) Mean(+S.E.M.) discrimination score for the alcohol only substitution test. CNO significantly increased discrimination score at 0.1, 0.3 and 1.0 g/kg alcohol doses compared to vehicle and mCherry control suggesting that the alcohol component of the compound cue is particularly sensitive to modulation by mPFC→AcbC projections. Solid lines indicate mean discrimination score from 2 water sessions prior to testing. Dashed lines indicate mean discrimination score from 2 N+A sessions prior to testing. +-denotes vehicle condition is significantly different from N+A baseline (p<0.05); *-denotes significant difference from vehicle and mCherry control (p < 0.05).
