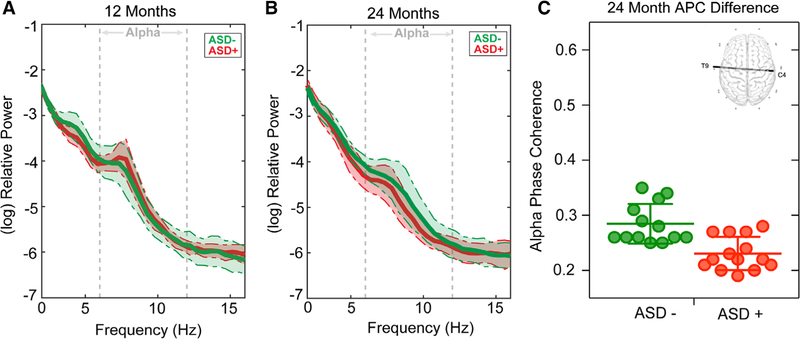
Figure 3.
This figure illustrates ASD+ and ASD− infants. (A) 12 month and (B) 24 months log-transformed power spectral density (average of all 25 channels) for both TSC (orange) and TD participants (green). Shaded regions represent the median absolute deviation. (C) Dot plot demonstrating APC for electrode pair T9-C4 (with group mean and error bars representing SD) for both ASD+ and ASD− groups. The scalp map of the interhemispheric connection that differentiated ASD+ from ASD− infants at 24 months is depicted (top right).

