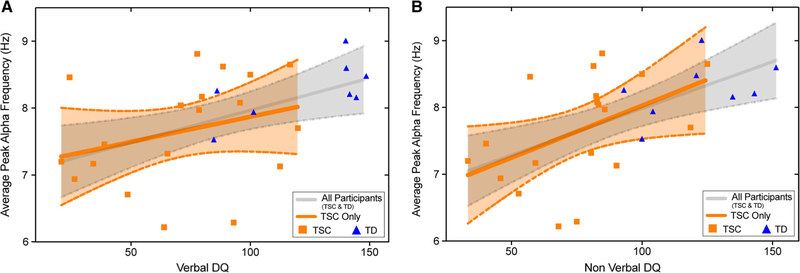
Figure 4.
Scatter plots demonstrating the relationship between 24-month average PAF (averaged over frontal; central and occipital regions) and 36 months (A) VDQ, and (B) NVDQ. Plots represent the association (and 95% confidence intervals) for both the entire sample (gray), and restricted to TSC participants (orange).

