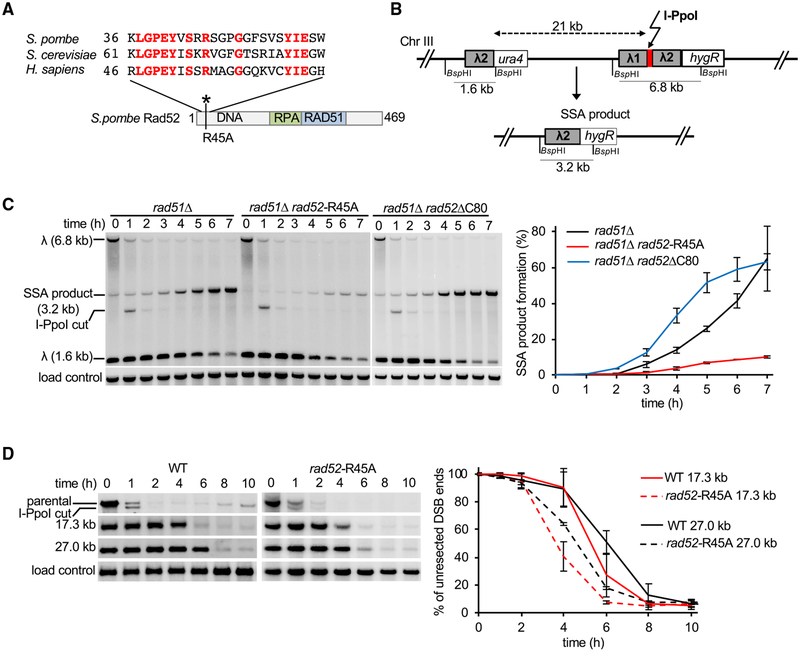
Figure 4. Analysis of DNA-Binding Domain of Rad52 in Resection Control.
(A) Sequence comparison of yeasts and human Rad52.
(B) Schematic of new SSA assay between two ~0.75-kb λ2 repeats inserted at arg1 locus and 21 kb upstream of arg1.
(C) Southern blot analysis of SSA in indicated rad52 mutants deficient in DNA binding (rad52-R45A) or C-terminal domain (rad52ΔC80). Plot shows kinetics of SSA product formation. Error bars denote SD (n = 3).
(D) Comparison of extensive resection kinetics in wild-type and rad52-R45A mutant cells. Plots show kinetics of resection, and error bars denote SD (n = 3).

