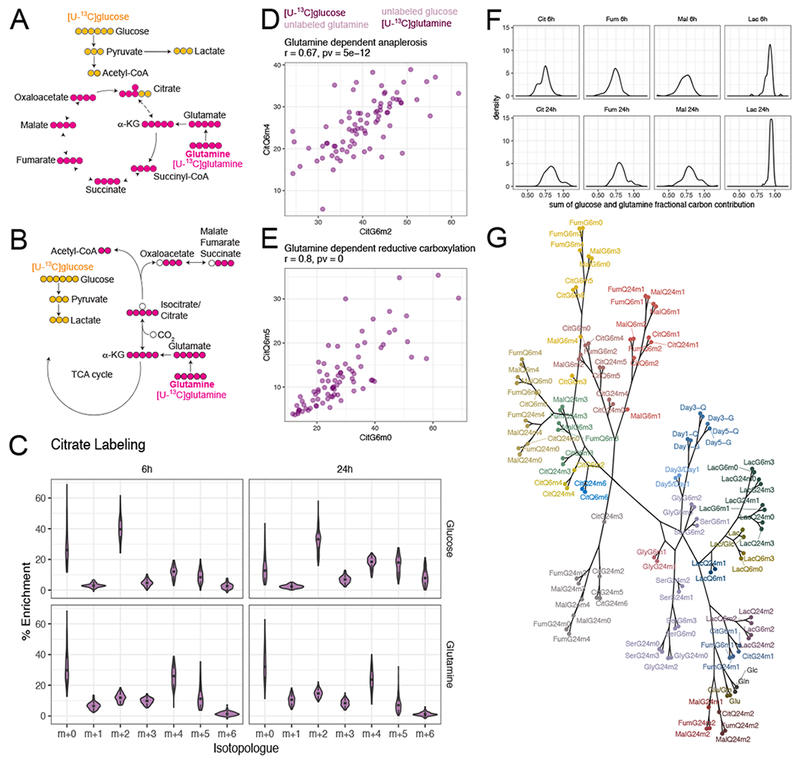
Figure 2. Differential pathway utilization inferred by mass isotopologue distributions.

(A and B). Schematics of representative isotopologues generated from [U-13C]glucose or [U-13C]glutamine labeling through glutamine-dependent anaplerosis (A) or glutamine-dependent reductive carboxylation (B).
(C). Violin plots showing distribution of citrate isotopologues from different tracers and different labeling durations. See also Figure S2.
(D and E). Scatterplots showing that enrichment of signature isotopologues produced from two different tracers for the same metabolic pathway (glutamine-dependent anaplerosis in D and glutamine-dependent reductive carboxylation in E) are highly correlated with each other. Figure title provides Pearson correlation coefficient and p-value.
(F). Distribution of the sum of glutamine and glucose fractional carbon contribution into different metabolites.
(G). Dendrogram of all metabolic features from hierarchical clustering with absolute Pearson correlation-based distance using Ward’s minimum variance method. The branches were arbitrarily colored.
Abbreviations: Cit, citrate; Fum, fumarate; Mal, malate; Lac, lactate; Ser, serine; Gly, glycine.
