
Figure 4. Associations between oncogenotypes and citrate mass isotopologues.
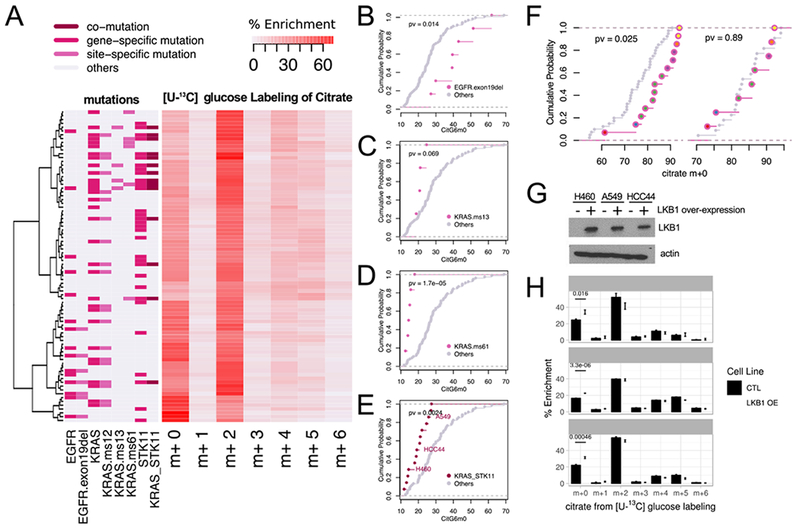
(A). Heatmap with hierarchical clustering of cell lines and citrate mass isotopologues from [U-13C]glucose labeling for 6h. Clustering was based on Ward’s minimum variance method. Relevant oncogenotypes are indicated.
(B-E). Cumulative distribution function plots showing different levels of CitG6m0 in cell lines with EGFR exon 19 deletion (B); KRAS missense mutation of the 13th codon (C); KRAS missense mutation of the 61st codon (D); and concurrent KRAS/STK11 mutation (E) compared to the rest of the cell lines (p-values based on K-S test). See also Table S3.
(F). Left, cumulative distribution function plots comparing citrate m+0 fractions between tumor fragments with or without EGFR mutations. Right, cumulative distribution function plots of the adjacent lung samples from the same patients. We compared 14 tumor fragments from 6 patients with EGFR mutations to 40 tumor fragments from 22 EGFR WT patients, whereas for the adjacent lung, we compared 8 fragments from 6 patients with EGFR mutations to 22 fragments from 22 EGFR WT patients. Patient origins of the EGFR mutant fragments are indicated by different colors inside the circles. (p-values based on K-S test)
(G). Western blot for LKB1 (encoded by STK11) in three cell lines with co-mutant KRAS and STK11. OE, over-expression.
(H). Re-expression of LKB1 in cell lines with co-mutant KRAS and STK11 increases CitG6m0 after labeling with [U-13C]glucose. Data are mean ± SEM.