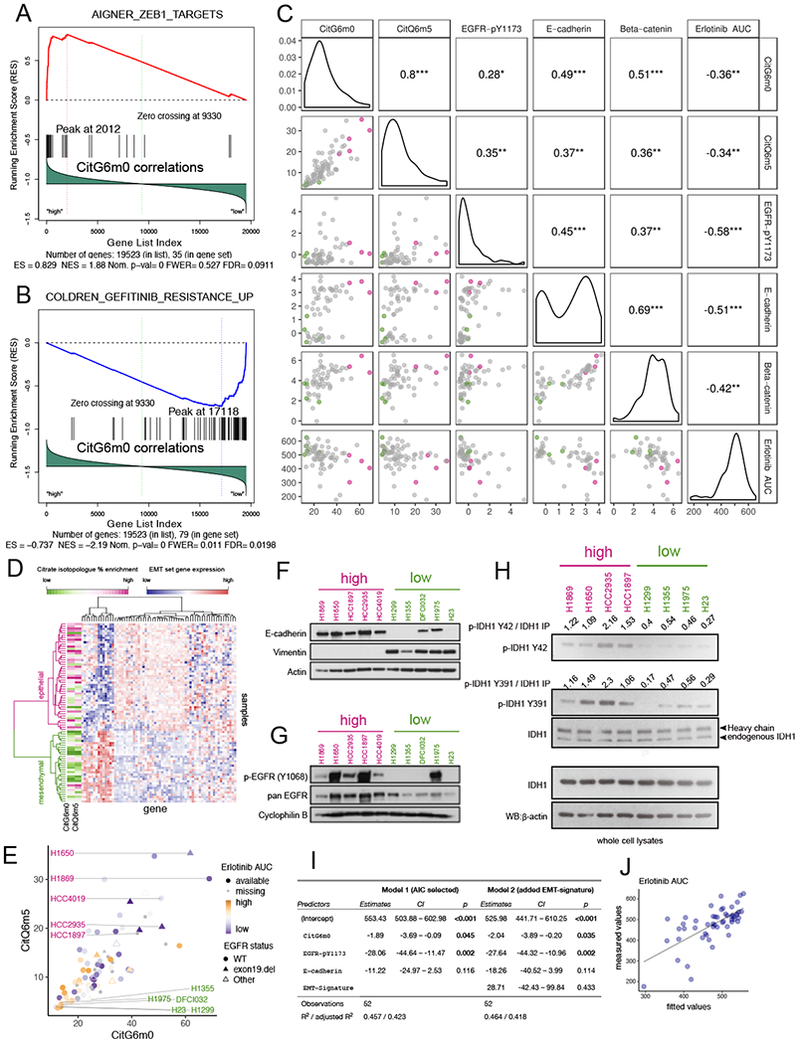
Figure 5. Reductive carboxylation is associated with an epithelial state and is enriched in cell lines sensitive to EGFR inhibitors.

(A-B). Gene Set Enrichment Analysis (GSEA) identified CitG6m0 as positively correlated with ZEB1 target genes (A) and negatively correlated with Gefitinib resistance genes (B).
(C). Scatterplot and pairwise Pearson correlation among GDRC metabolic features CitG6m0, CitQ6m5; RPPA features beta-catenin, E-cadherin and EGFR-pY1173; and compound sensitivity feature Erlotinib AUC (higher area under the dosing curve represents higher resistance). The color scheme for points in the scatterplot is explained in the legend for (E). ***, p<=0.001; **, p<=0.01; *, p<=0.05.
(D). Heatmap with hierarchical clustering of samples and EMT signature genes. Clustering was based on Ward’s minimum variance method. The CitG6m0 and CitQ6m5 fractions are indicated by the color scale. Higher levels of GDRC metabolic features were observed for the epithelial cluster.
(E). Scatter plot of CitG6m0 and CitQ6m5 with EGFR mutation status marked by different symbols and EGFR inhibitor sensitivity indicated by different color and shapes. Five GDRC-high cell lines (magenta lettering) and five GDRC-low cell lines (green lettering) were selected for further characterization. These cell lines are also indicated by coloring in (C).
(F-G). Validation of EMT status and EGFR activation by western blot in 10 selected cell lines. In (F), the epithelial marker E-cadherin is expressed in GDRC-high cell lines, whereas the mesenchymal marker vimentin is expressed GDRC-low cell lines. In (G), p-EGFR (Y1068) indicative of EGFR activation is more prominent in GDRC-high cell lines.
(H). Higher phosphorylation of IDH1 on Y42 and Y391 in cell lines with high GDRC.
(I). Coefficients and p-values from multiple regression models predicting inhibitor sensitivity from different feature sets. Model 1 was obtained from stepwise feature selection based on Akaike information criterion (AIC) with input features including CitG6m0, CitQ6m5, EGFR-pY1173, E-cadherin, beta-catenin and EMT class. Model 2 adds the EMT-signature (EMT class) into Model 1. Note that p-values for CitG6m0 are significant in both models while controlling for the RPPA features or gene expression-derived EMT feature.
(J). Scatterplot of fitted values from model 1 in (I) and the measured value (Erlotinib AUC).
