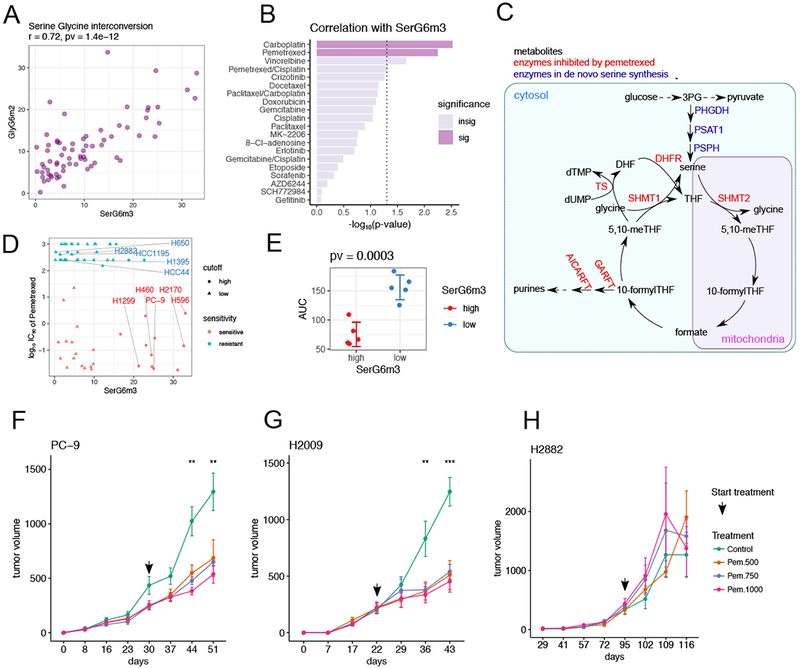
Figure 6. De novo serine synthesis from glucose is associated with sensitivity to pemetrexed.

(A). Scatterplot showing positive correlation between SerG6m3 and GlyG6m2. Correlation coefficient and p-value from Pearson correlation are provided in the title.
(B). Drug sensitivity correlations with SerG6m3. −log10 (p-values) from Pearson correlations are plotted and the hits ranked by decreasing statistical significance. The dashed line demarcates the nominal p-value cut-off of 0.05 after −log10 transformation, and the darkly-colored bars denote statistical significance after multiple comparison controlled by beta uniform mixture modeling of p-values. See also Table S4.
(C). Schematic of serine biosynthesis feeding into one-carbon metabolism. Metabolites are in black, serine de novo synthesis enzymes are in blue and enzymes reportedly targeted by pemetrexed are in red.
(D). Relationship between SerG6m3 and pemetrexed IC50, and selection of cell lines for further characterization. Note that almost all the cell lines with high SerG6m3 are sensitive to pemetrexed. Cell lines are colored based on pemetrexed sensitivity. 5 pemetrexed sensitive cell lines with high SerG6m3 and 5 pemetrexed resistant cell lines with low SerG6m3 were selected for further characterization.
(E). Validation of pemetrexed sensitivity between selected cell lines with high and low SerG6m3 fractions. P-value from t-test is displayed in the title. Each dot represents average from triplicates for a single cell line; error bars denote mean ± SD for each group. See also Figure S6.
(F-H). In vivo testing of pemetrexed sensitivity in xenograft mouse models. PC-9 (F) and H2009 (G), cell lines sensitive to pemetrexed in culture, are also sensitive to pemetrexed in vivo, whereas the pemetrexed-resistant cell line H2882 (H) retains this resistance in vivo. The arrow indicates the time when pemetrexed therapy was initiated. Data are mean ± SEM. Statistical significance at each time point was determined by one-way ANOVA. ***, p<=0.001; **, p<=0.01. 4-5 mice were used for each treatment condition.
