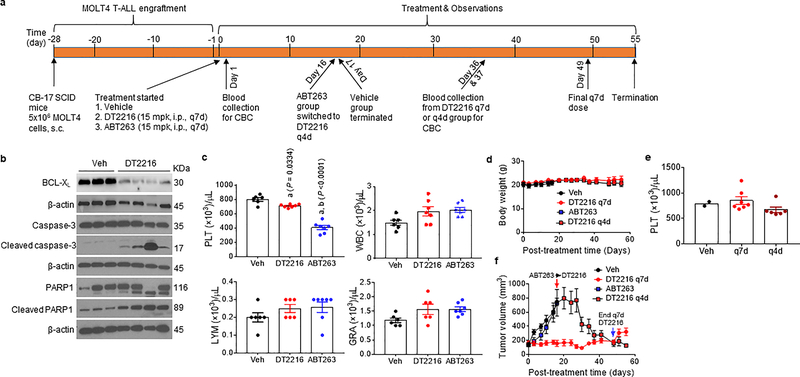
Extended Data Fig. 8. DT2216 induces regression of MOLT-4 xenografts without causing thrombocytopenia.
a, Illustration of the experimental design of MOLT-4 T-ALL xenograft mouse model. b, Representative of two independent immunoblot analyses of BCL-XL, cleaved and full-length caspase-3 and PARP1 in MOLT-4 T-ALL xenografts harvested two days after tumor-bearing mice were treated with a single injection of vehicle (Veh) or DT2216 (15 mpk/i.p.). c, Blood platelets (PLT), white blood cells (WBC), lymphocytes (LYM) and granulocytes (GRA) were numerated one day after first treatment with vehicle (Veh), DT2216 (15 mpk/i.p.) or ABT263 (15 mpk/i.p.) as shown in a. a and b represents statistical significance vs. Veh and DT2216, respectively, determined by one-way ANOVA and Tukey’s multiple comparison test. d, Body weight changes in mice after the start of treatment with vehicle (Veh), DT2216 or ABT263 as shown in a. e, Numeration of PLT one day after the 6th dose of DT2216 (15 mpk/q7d/i.p. or 15 mpk/q4d/i.p.). Data are presented as mean ± SEM (n = 2 mice in Veh, 7 mice in DT2216 q7d, and 6 mice in DT2216 q4d). f, Changes in tumor volume over time after the start of treatment with vehicle (Veh), DT2216 or ABT263 as shown in a. Data presented in c, d and f are mean ± SEM (n = 6 mice for Veh group and 7 mice each for DT2216 and ABT263 groups). Each symbol in c and e represents data from an individual animal.

