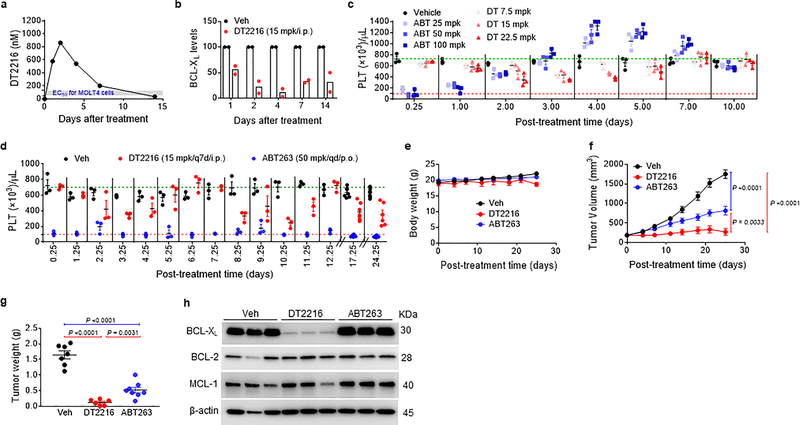
Figure 4. DT2216 is more potent against MOLT-4 T-ALL xenografts and less toxic to platelets than ABT263 in mice.
a, Concentration of DT2216 in MOLT-4 tumors after a single DT2216 administration (15 mpk/i.p.). Data represents average of two mice in a group at each time point. b, Densitometric analysis of BCL-XL protein levels in tumors (mean, n = 2 mice in a group at each time point) at different durations after a single Vehicle (Veh) or DT2216 administration (15 mpk/i.p.). Each symbol represents data (% of Veh) from an individual animal. The representative immunoblots are shown in Extended Data Fig. 5e. c, Numeration of platelets (PLT) 0.25, 1, 2, 3, 4, 5, 7 and 10 days after a single i.p. injection with DT2216 or p.o. dosing with ABT263 at indicated doses. Data are represented as mean ± SEM (n = 3 mice in each group). Each symbol represents data from an individual animal. d, Numeration of PLT after the mice were continuously treated with DT2216 or ABT263 as indicated. Data are represented as mean ± SEM (n = 3 mice in each group till day 12.25; n = 7 mice in Veh, 7 mice in DT2216, and 8 mice in ABT263 at day 17.25; n = 7 mice in Veh, 6 mice in DT2216, and 8 mice in ABT263 at day 24.25). Each symbol represents data from an individual animal. e, f, Body weight and tumor volume changes in mice after the start of treatment with vehicle (Veh), DT2216 (15 mpk/q7d/i.p.) or ABT263 (50 mpk/qd/p.o.). Data presented are mean ± SEM (n = 7 mice in Veh, 7 mice in DT2216 and 8 mice in ABT263 at the start of treatment). Statistical significance was determined by two-sided unpaired Student’s t-test. g, MOLT-4 tumor bearing mice were sacrificed 25 days after treatment initiation (four days and one day after last dose of DT2216 and ABT263, respectively). Tumor weights at the end of study are shown. Data are presented as mean ± SEM (n = 7 mice in Veh, 6 mice in DT2216 and 8 mice in ABT263). Each symbol represents data from an individual animal and the middle horizontal line represents mean. Statistical significance was determined by two-sided unpaired Student’s t-test. h, Immunoblot analysis of BCL-XL, BCL-2 and MCL-1 in MOLT-4 tumors (n = 3 mice in each group). Mpk, mg/kg; q7d, once a week treatment; qd, daily treatment. The uncropped immunoblot images related to this figure are provided in separate source data file.

