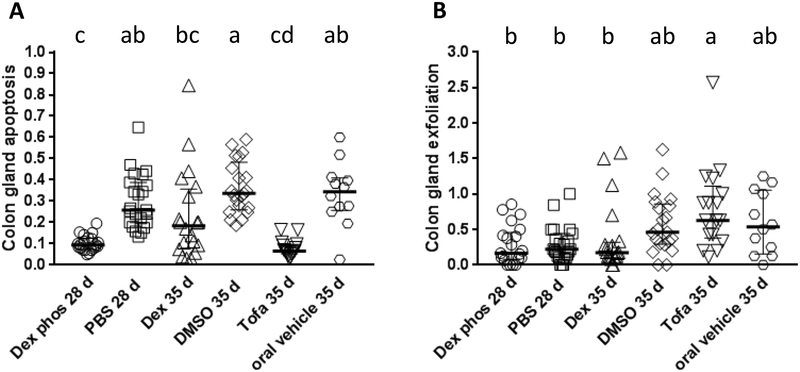
Figure 3: Comparison of apoptosis and gland exfoliation in the GPx1/2-DKO colon treated with immune suppressants.
Each symbol represents one mouse. Panel A and B show the median and interquartile range of number of apoptosis in each gland and exfoliated cells per 10× field, respectively. When groups do not share letters, they are significantly different. The complete results of pairwise comparisons to show suggestive effects are shown in Supplementary Table 3.

