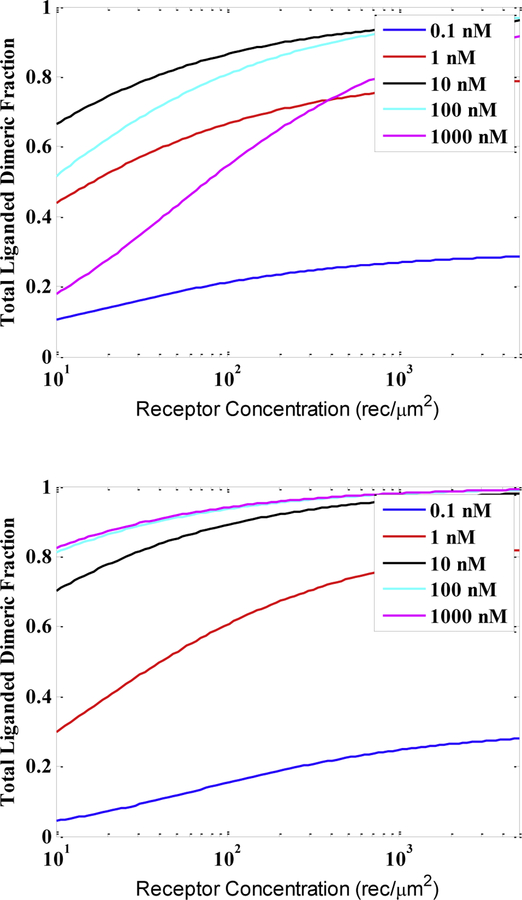
Fig. 5.
Predictions of liganded dimeric fractions as a function of receptor concentration for different fixed ligand concentrations. This is the active receptor fraction in the context of the working model in Figure 4. Top: Dimeric ligand (see Figure 4A for thermodynamic cycle) where K1 = .029 μm2/rec, L1 = 9.6*107 M−1, and Λ2 = 4.3*109 M−1. Bottom: Monomeric ligand (see Figure 4B for thermodynamic cycle) where K1 = .088 μm2/rec, L1 = 9.6*107 M−1, Λ2 = 4.3*109 M−1, and Λ3 = 4.3 *108 M−1.

