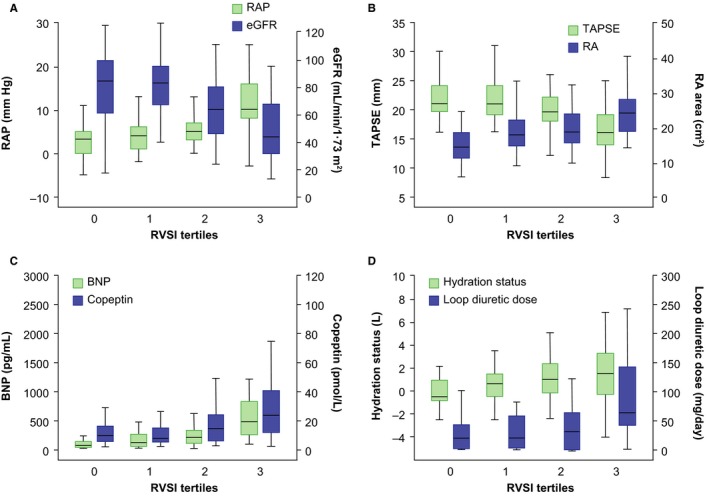
Figure 5.

RVSI and associated clinical parameters. Severity of renal congestion can be evaluated by measurement of RVSI using renal Doppler ultrasonography. The figure illustrates the associations of RVSI tertiles with RAP and renal function (A), right ventricular systolic function and RA area (B), neurohormonal status (C), and hydration status (D). Fluid overload as measured by bioimpedance is likely to occur because of hemodynamic alterations and neurohormonal activation leading to a deterioration of renal function and fluid retention. BNP indicates B‐type natriuretic peptide; eGFR, estimated glomerular filtration rate (based on Chronic Kidney Disease Epidemiology Collaboration creatinine–cystatin C equation); RA, right atrial; RAP, right atrial pressure; RVSI, renal venous stasis index; TAPSE, tricuspid annular plane systolic excursion; VII, venous impedance index.
