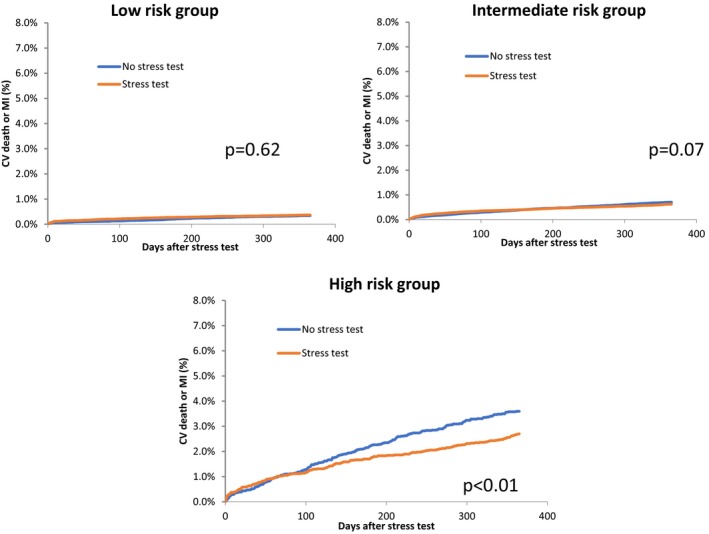
Figure 3.

Cumulative incidence frequency curves for the low‐, intermediate‐, and high‐risk groups comparing cardiovascular (CV) death or myocardial infarction (MI) between the testing and the nontesting groups.

Cumulative incidence frequency curves for the low‐, intermediate‐, and high‐risk groups comparing cardiovascular (CV) death or myocardial infarction (MI) between the testing and the nontesting groups.