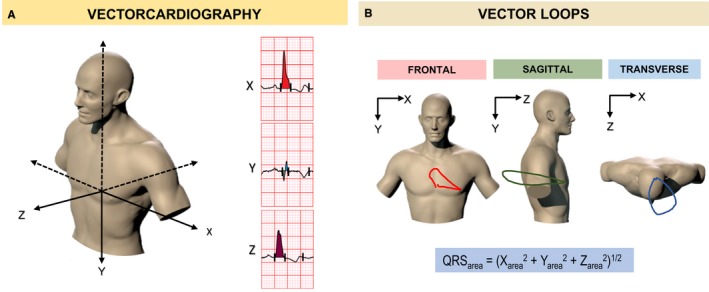
Figure 1.

Vectorcardiography in cardiac resynchronization therapy. The vectorcardiogram displays the various features of the ECG, such as the QRS complex, in the form of “loops,” which are determined from vectors representing successive, instantaneous mean electrical forces throughout the cardiac cycle. A, A representation of the 3 vectorcardiogram leads (X, Y, and Z), according to Frank's orthogonal lead system. B, Two‐dimensional vector loops in the frontal (X‐Y leads), sagittal (Y‐Z leads), and transverse (X‐Z leads) planes from a patient with a left bundle branch block. The QRS area is calculated as the integral sum of the area bound by the QRS complex and the isoelectric baseline in each vectorcardiogram lead (X, Y, and Z).
