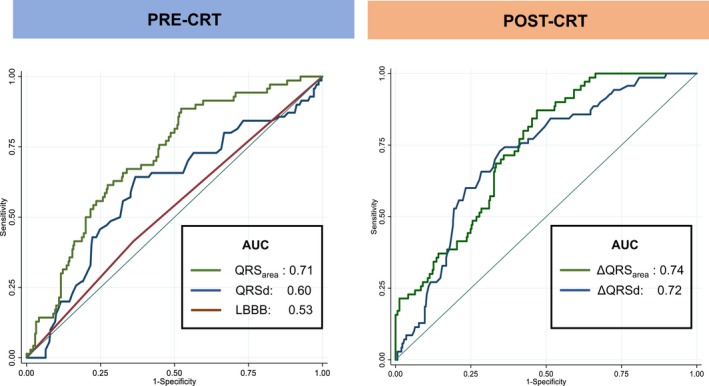
Figure 2.

Receiver‐operator characteristic curves. Graphs show areas under the receiver‐operator characteristic curves (AUC) for QRSd, QRS area, and QRS morphology (LBBB) in the whole cohort. AUC indicates area under the curve; CRT, cardiac resynchronization therapy; LBBB, left bundle branch block.
