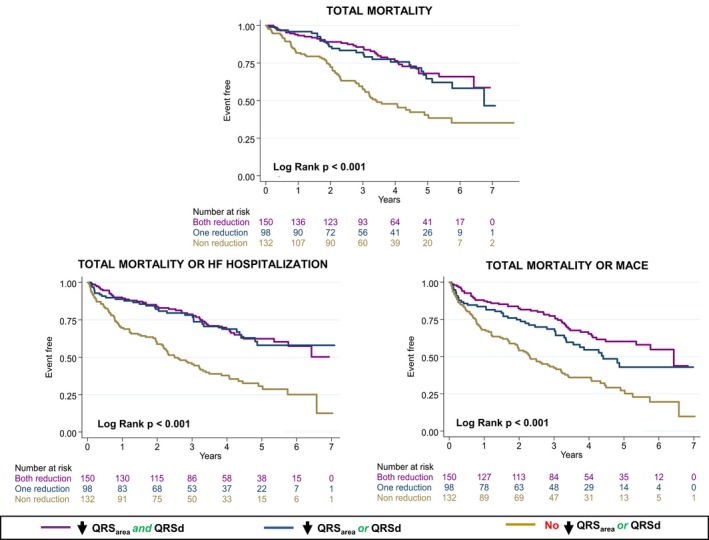
Figure 6.

Secondary clinical end points according to changes in QRS area and QRS duration. Kaplan–Meier survival curves for the various end points according to postcardiac resynchronization therapy reductions in QRS area (≥45 μVs) QRS duration (QRSd; to any value below baseline). HF indicates heart failure; MACE, major adverse cardiac events.
