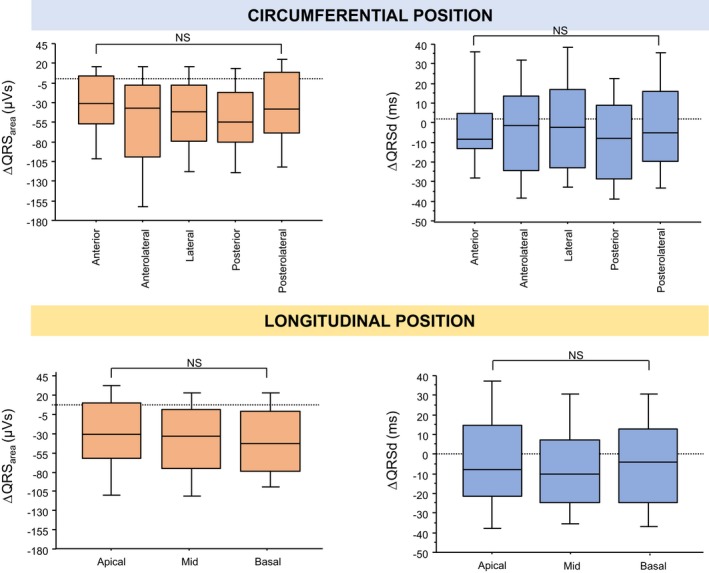
Figure 7.

Postimplantation changes QRS area and QRS duration according to left ventricular lead position. The figure shows post– cardiac resynchronization therapy changes in QRS area (ΔQRS area) and QRS duration (ΔQRSd) according to circumferential (upper panel) and longitudinal (lower panel) left ventricular lead positions. In the box‐and‐whisker plots, the horizontal line denotes the median, whereas the lower and upper limits of the box denote the first and third quartiles. The limits of the vertical bar denote maximum and minimum. NS indicates not significant.
