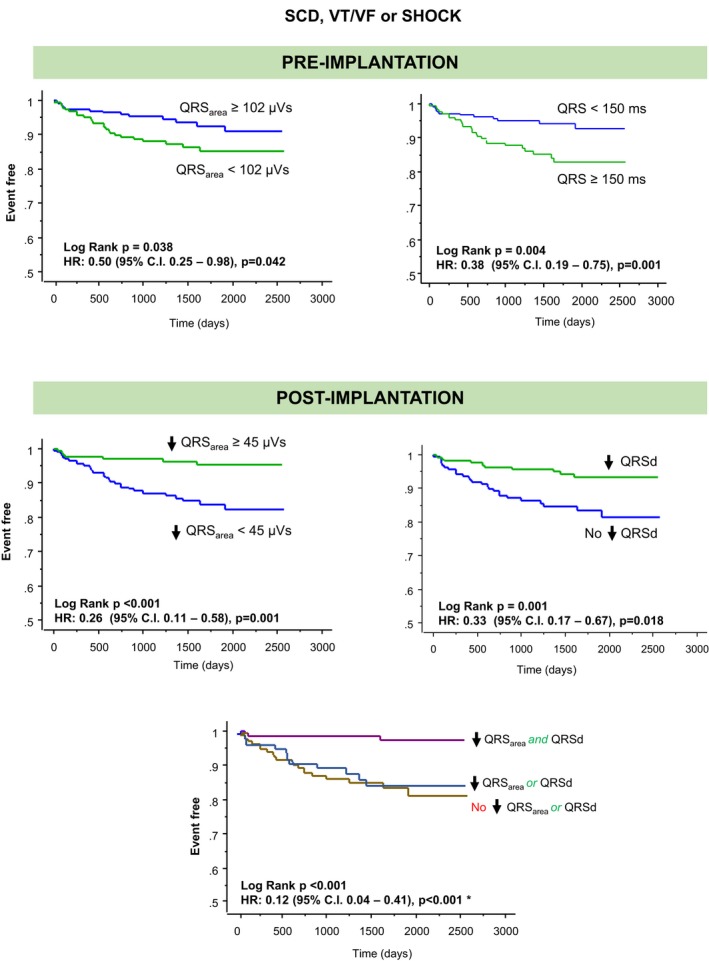
Figure 8.

Sudden cardiac death and ventricular arrhythmias according to postimplantation changes in QRS area and QRS duration. Kaplan–Meier survival curves for the combined end point of sudden cardiac death (SCD), ventricular tachycardia (VT)/ventricular fibrillation (VF), or shock according to postimplantation reductions in QRS area (QRS area, ≥45 μVs) QRS duration (QRSd to any value below baseline). *Refers to the comparison of the group with concomitant reductions in QRS area (≥45 μVs) and QRSd against the group with no reductions in either variable. HR indicates hazard ratio.
