Figure 2.

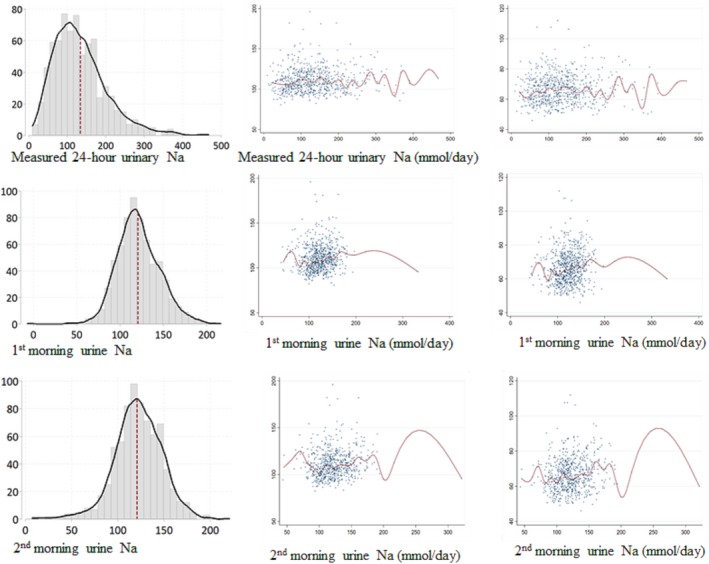
Histogram of 3 types of urinary Na measurements, and scatter plots with median spline graphs between the unadjusted relationship with blood pressure and 3 types of urinary Na measurements.

Histogram of 3 types of urinary Na measurements, and scatter plots with median spline graphs between the unadjusted relationship with blood pressure and 3 types of urinary Na measurements.