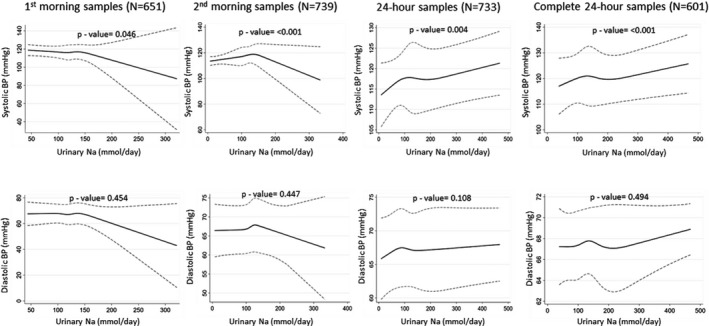
Figure 4.

Restricted cubic spline plots (solid lines) and 95% CI (dashed lines) for urine sodium and blood pressure when adjusted for age, sex, body mass index, smoking status, physical activity, and household wealth. Restricted cubic splines were plotted with knots at fifth, 27.5th, 50th, 72.5th, and 95th percentiles. BP indicates blood pressure.
