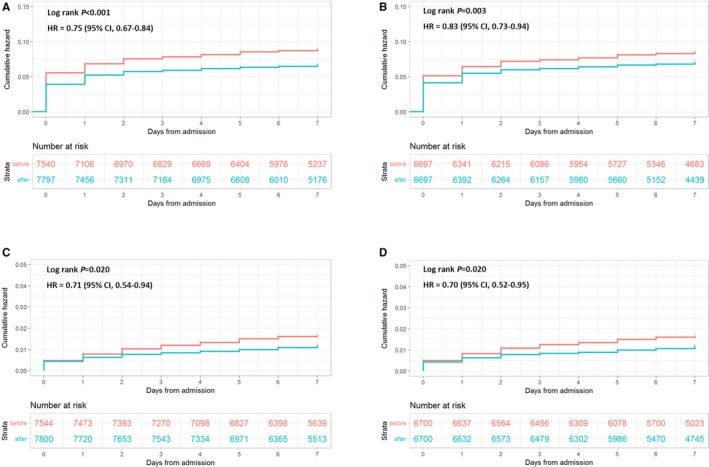
Figure 2.

Cumulative Kaplan–Meier curve estimates of outcomes within 7 days after hospitalization. Data for MACE in the whole study population (A) and the propensity score–matched population (B). Data for all‐cause death in the whole study population (C) and the propensity score‐matched population (D). HR indicates hazard ratio; MACE, major adverse cardiovascular events.
