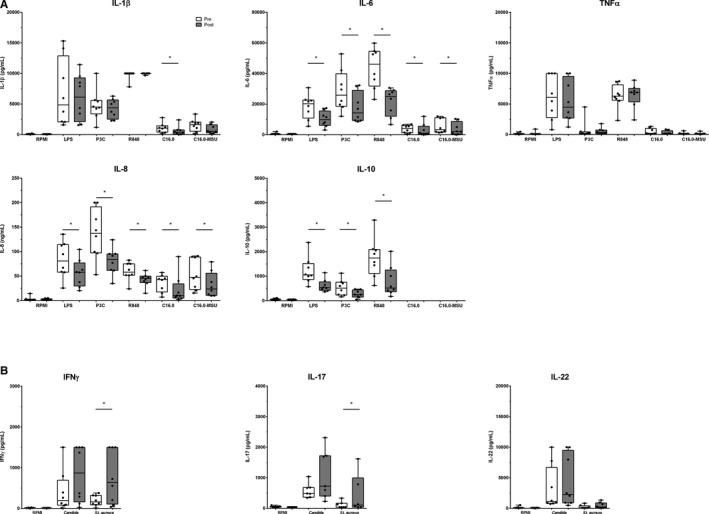
Figure 3.

A and B, Cytokine production capacity of PBMCs. A, Innate cytokine production after 24‐hour stimulation (n=8). B, Adaptive cytokine production after 7‐day stimulation (n=8). Data before (white) and after intervention (grey) are shown in boxplots (median±interquartile range). Whiskers represent 95% CI. IL indicates interleukin; LPS, lipopolysaccharide; P3C, Pam3CysK4; R848, Resiquimod; C16.0+MSU, C16.0 with monosodium urate crystals, IFNγ; interferon‐gamma. *P<0.05.
