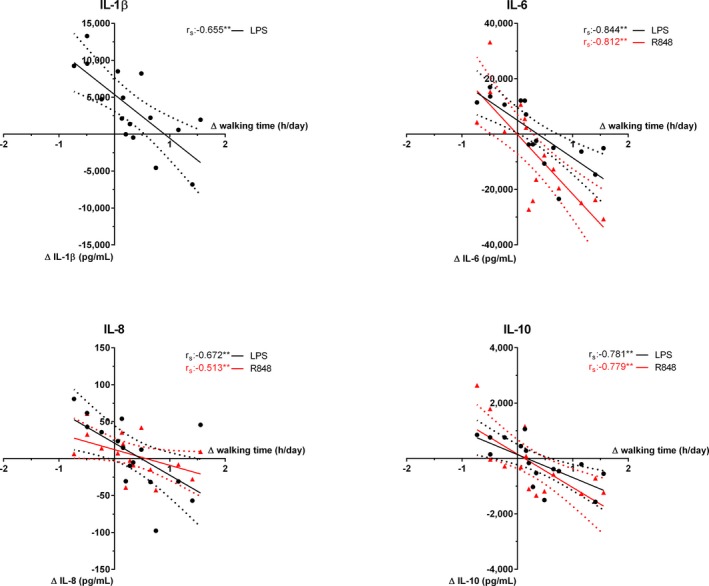
Figure 4.

Cytokine production capacity correlated with walking time per day (n=16). The change in cytokine concentration after LPS (black) and R848 (red) stimulation correlated with the change in walking time. Linear regression with 90% CI. IL indicates interleukin; LPS, lipopolysaccharide; R848, Resiquimod. *P<0.05, **P<0.01, r s: Spearman correlation coefficient.
