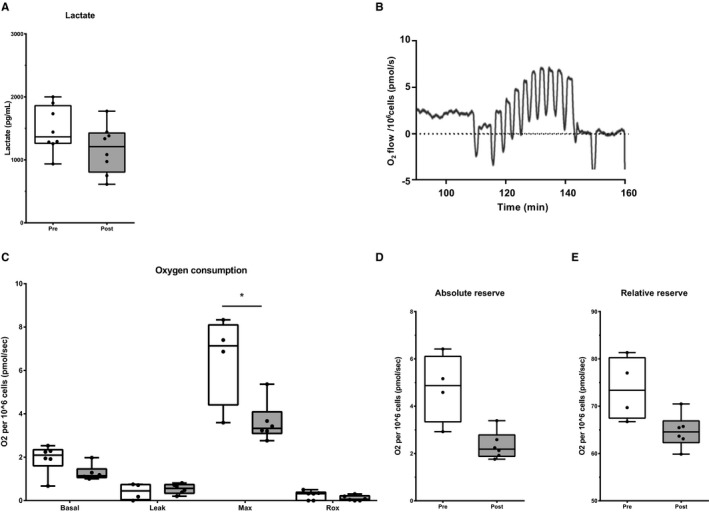
Figure 5.

A through E, Metabolism of PBMCs. A, Extracellular lactate production in unstimulated PBMCs (n=8). B, Representative result of the OROBOROS. C, Oxygen consumption is presented as basal respiration (basal) (n=6), proton leak after inhibition of ATP synthase (leak) (n=4), maximal oxygen consumption (max) (n=4), residual oxygen consumption or non‐mitochondrial oxygen consumption (rox) (n=6). D and E, Absolute and relative oxygen consumption reserve (n=4). Data before (white) and after intervention (grey) are shown in boxplots (median±interquartile range). Whiskers represent 90% CI. *P<0.05.
