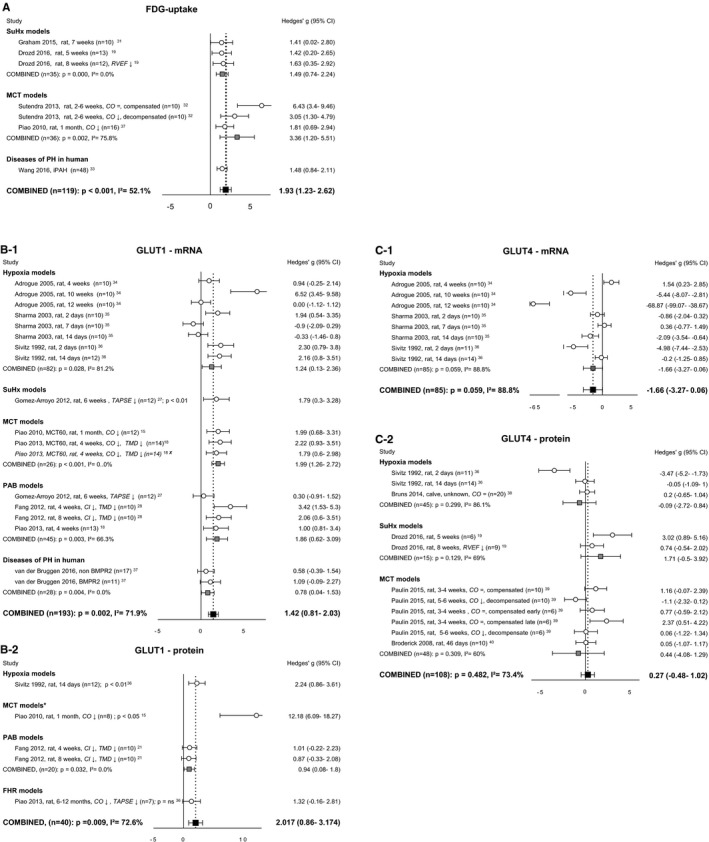
Figure 2.

Right ventricular uptake of carbohydrates. Forrest plots of FDG‐uptake (A), GLUT1 expression at mRNA (B‐1) and protein (B‐2) level, and GLUT4 expression at mRNA (C‐1) and protein (C‐2) level. Data are presented as Hedges’ g. Combined Hedges’ g are presented as squares: gray representing Hedges’ g of a specific model, black representing Hedges’ g of all included studies. Bars represent 95% CI. = indicates not statistically significant affected; ↓, decreased; CI, cardiac index; CO, cardiac output; FDG uptake, fluorodeoxyglucose uptake; GLUT, glucose transporter; i2, level of heterogeneity; MCT, monocrotaline; n, number of included animals; RVEF, right ventricular ejection fraction; TAPSE, tricuspid annular plane systolic movement; X, not included in meta‐analysis. *Significantly (P<0.05) increased compared with hypoxia, pulmonary artery banding‐ and fawn hooded rats‐models.
