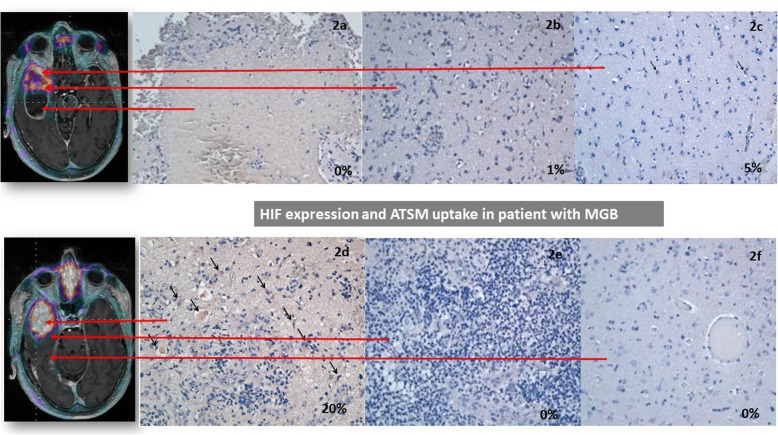
Fig. 2.
Spatial correlation between [64Cu][Cu(ATSM)] PET images and HIF-1α expression. a Necrotic area surrounded by neoplastic cells, no HIF-1α signal was detected. b High cellular neoplastic area, 1% of positive cells to HIF-1α. c Peripheral tumour area with lower cellularity, 5% of positive cells to HIF-1α corresponding to SUVmax of 2.7. d Central neoplastic area with HIF-1α expression in 20% of the cells (arrows) corresponding to SUVmax of 4.9. e Neoplastic area associated inflammatory infiltrate, no HIF-1α positive cells observed. f. Peripheral area adjacent to the tumour, reactive gliosis. Absent expression of HIF-1α. a-f The selection of the regions is based on manual reporting from the neurosurgeons

