Fig. 1.
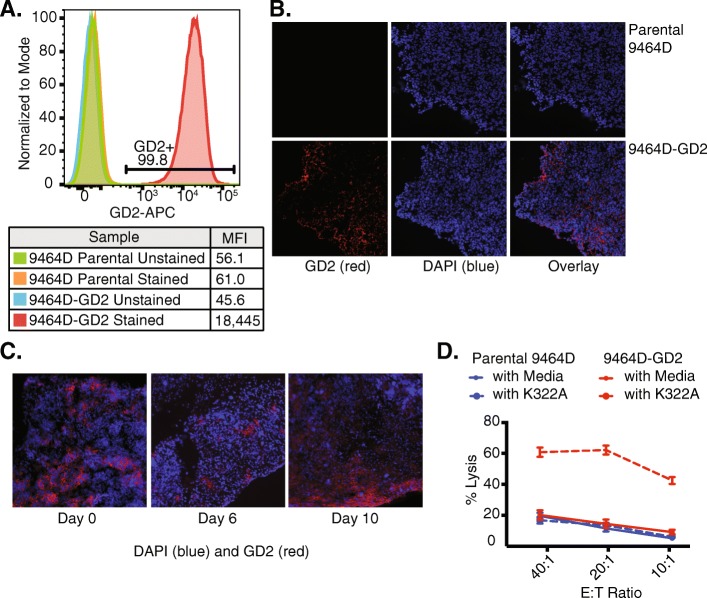
Retained GD2 expression in 9464D-GD2 after growth in vitro and in vivo and increased ADCC. a GD2 expression levels in 9464D parental and 9464D-GD2 cells growing in vitro were assessed by flow cytometry. Mean fluorescence intensity (MFI) of GD2 expression is shown for 9464D parental and 9464D-GD2 cells labeled with anti-GD2 mAb compared to the unstained controls. b After 8–10 weeks of growth in vivo, 9464D parental (top row) and 9464D-GD2 tumors (bottom row) were harvested and analyzed by IHC for GD2 expression (red, left panel). DAPI was used to stain the nuclei of cells (blue, middle panel), and the overlay of blue and red is in the right panel. c 9464D-GD2 tumors were harvested at baseline as well as 6 and 10 days after delivery of 12 Gy to the tumor and analyzed by IHC for GD2 expression. Sections were stained with DAPI alone (blue) anti-GD2-PE (red). d A chromium release assay was performed with different effector to target (E:T) ratios to compare cell-mediated cytotoxicity of parental 9464D and 9464D-GD2 cells incubated with or without hu14.18K322A. Percent lysis is shown for each E:T ratio (mean ± SEM)

