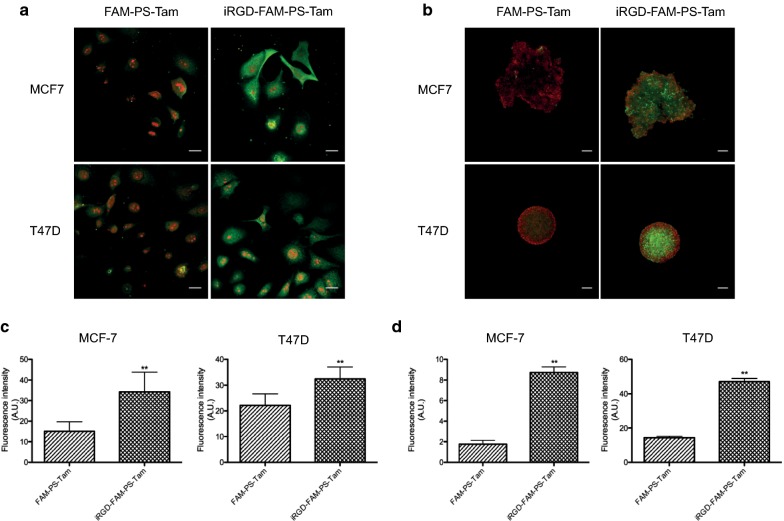
Fig. 2.
Internalization of PS in breast cancer cells in 2D and 3D culture. a MCF7 and T47D cells were seeded on glass coverslips in 24-well plates. After 24 h, FAM-PS-Tam or iRGD-FAM-PS-Tam were added to the cells at a concentration of 0.5 mg/mL and incubated for 1 h or 24 h. Confocal images of cells at 24 h of treatment. PS are labelled in green and nuclei are counterstained with propidium iodide (red). Scale bars: 20 μm. b MCF7 and T47D spheroids were allowed to develop for 7 days as explained in materials and methods. At that time, they were either treated with FAM-PS-Tam or iRGD-FAM-PS-Tam at a concentration of 0.5 mg/mL and incubated for 1 h or 24 h. Confocal images at 24 h are shown. PM are labelled in green and nuclei are counterstained with propidium iodide (red). Scale bars: 100 μm. c Quantification of the fluorescence intensity/cell for MCF-7 and T47D cells. A statistically significant increase was detected in cells treated with iRGD-FAM-PS-Tam compared to FAM-PS-Tam; graph shows PS fluorescence in arbitrary units; bars represent mean ± SEM; N = 3; student’s t test was performed to analyze statistical significance, **p < 0.01. d Quantification of the fluorescent intensity per spheroid for MCF-7 and T47D cells. A statistically significant increase was detected in spheroids treated with iRGD-FAM-PS-Tam compared to FAM-PS-Tam. Graph shows PS fluorescence in arbitrary units; bars represent mean ± SEM; N = 3; student’s t test was performed to analyze statistical significance **p < 0.01

