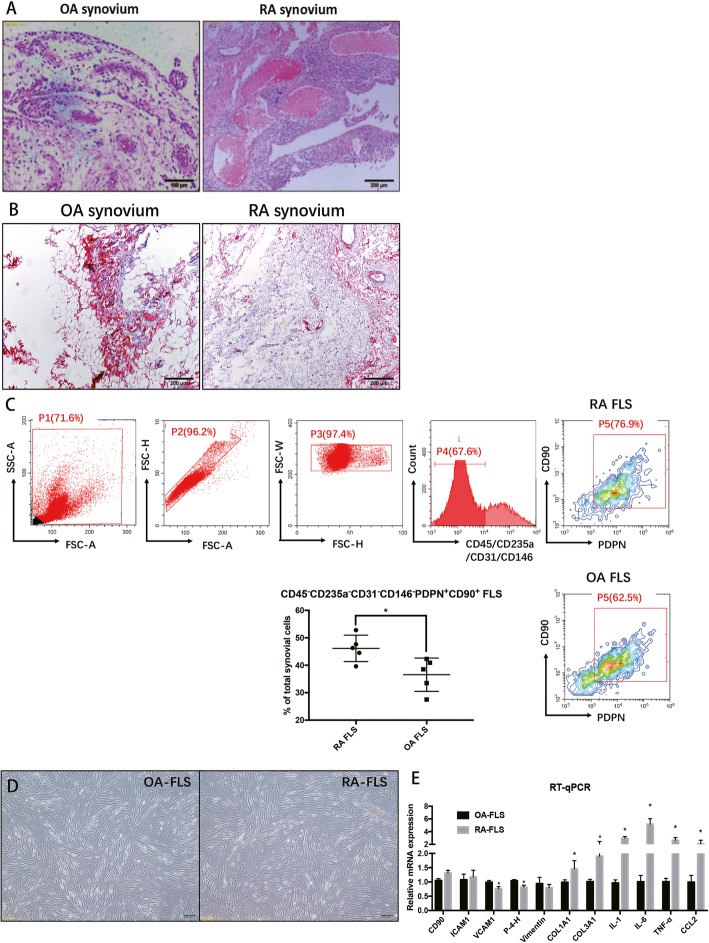
Fig. 1.
a H&E staining showed the typical pathological status of OA and RA hyperplastic synovial tissues. b Masson staining validated that the hyperplastic fibroblast is more prominent in an RA synovium. c The sorted number of FLS using the CD45−CD31−CD146−CD235a−CD90+PDPN+ sorting strategy. d The sorted OA and RA FLS exhibited a classic spindle-shaped fibroblastic morphology. e The comparison of markers of FLS in both OA FLS and RA FLS, as measured by qRT-PCR. Each bar in the figure represents the mean ± SEM of triplicates. *P < 0.05

