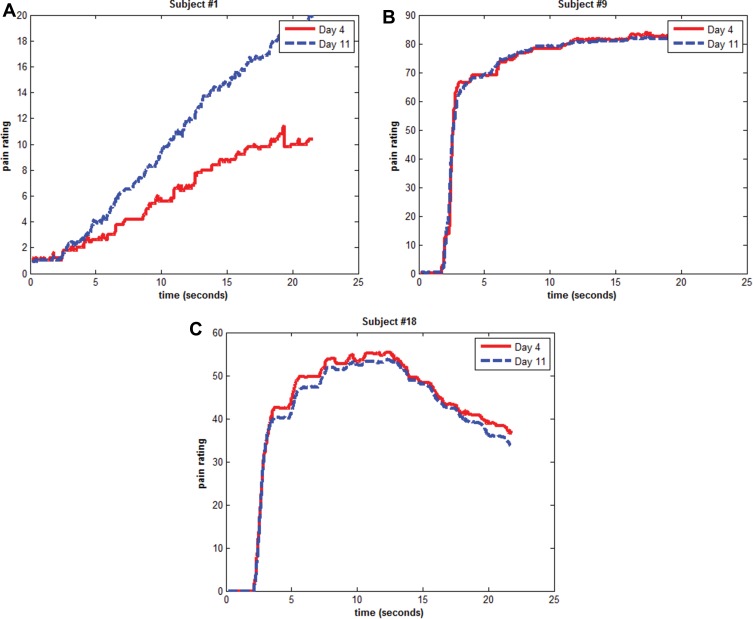
Figure 3.
Variability in Shape of TS Curves and Stability of Curve Shape Over Time. (A) Subject #1, with long Lag, low Slope, and minimal Delta. (B) Subject #9, with short Lag, moderate Slope, and minimal Delta. (C) Subject #18, also with short Lag, moderate Slope but a large Delta.
Notes: The red curve represents the average TS curve from day 4 and blue represents the average TS curve from day 11.

