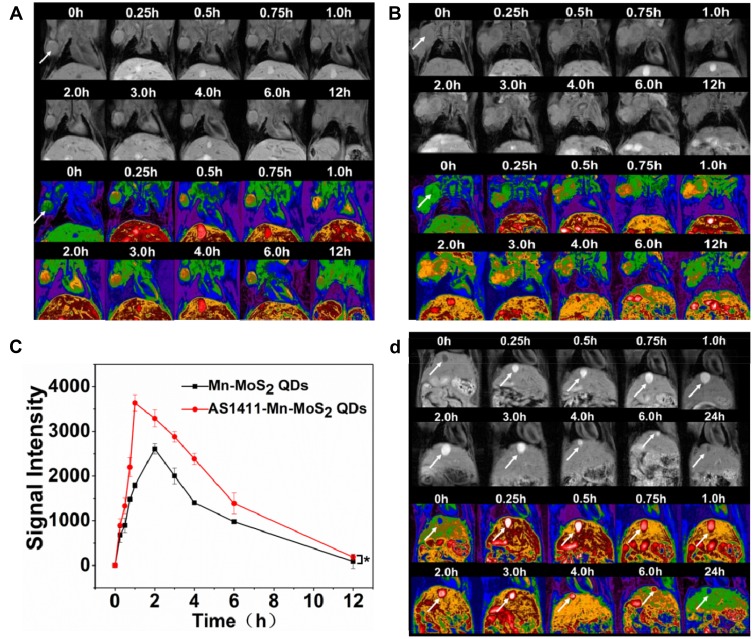
Figure 7.
T1-weighted in vivo MR imaging of mice pre- and post-injection of (A) Mn-MoS2 QDs and (B) AS1411-Mn-MoS2 QDs nanoprobe at different time points, the white arrows indicate tumor, *p < 0.05. (C) Signal intensity in the tumors, (D) T1-weighted MR images of mice pre- and post-injection of Mn-MoS2 QDs. The white arrows indicate gall bladder.

