Figure 5.
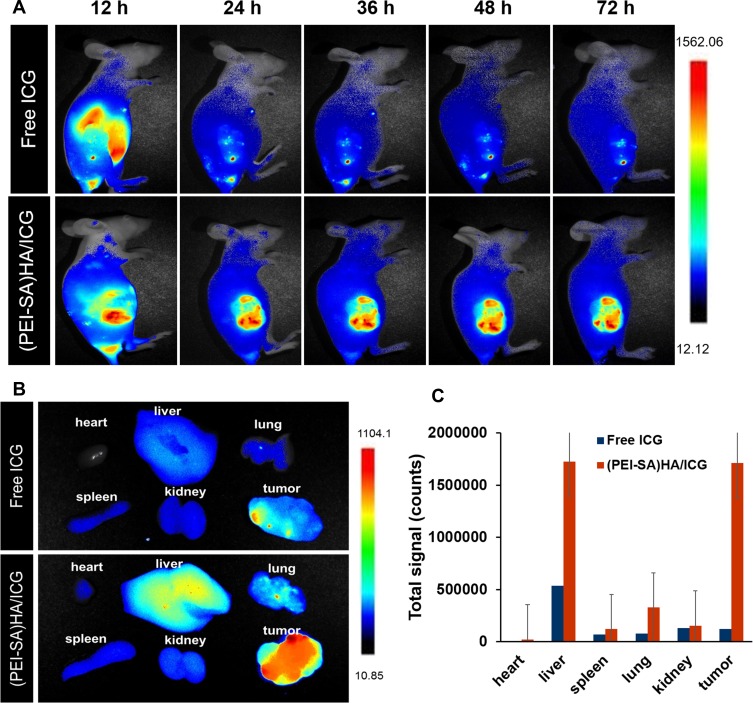
(A) Real-time fluorescence distribution of NPs in animals with respect to administration at different time points (12, 24, 36, 48, 72 h). (B) The fluorescence distribution of various tissues and organs of animals after 72 h. (C) The quantitative determination of the fluorescence intensity of tissues and organs after 72 h.

