Fig. 1.
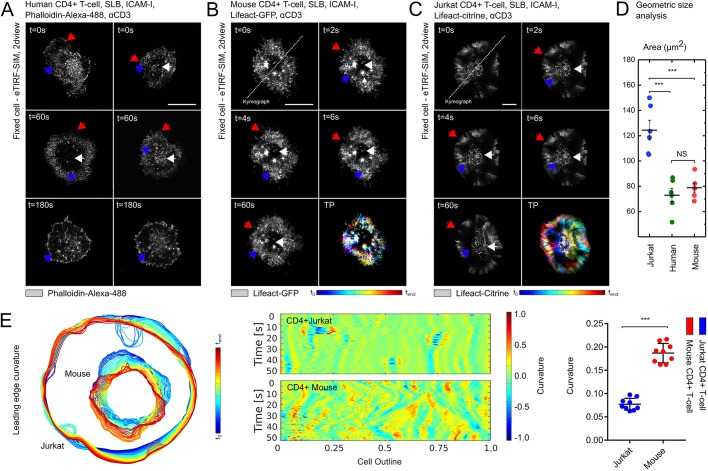
Distinct actin cytoskeleton architecture in primary and immortalised T-cells. (A–C) Representative TIRF-SIM images of fixed human CD4+ T-cells fluorescently labelled with phalloidin-Alexa-488 (A), live mouse CD4+ T-cells expressing F-actin (Lifeact-GFP; B), and Jurkat CD4+ T-cells expressing Lifeact-citrine at the basal membrane (C) showing the dynamics within 3 min after contact with the activating SLB. The three characteristic F-actin architectures lamellipodium (red arrows), lamellum (blue arrows) and ramified actin network (white arrow) are visible in the three T-cell types. (D) Geometric size analysis of the contact interface in human, mouse and Jurkat CD4+ T-cells in response to the activating SLB. Quantitative differences were observed in the geometric size analysis when comparing Jurkat CD4+ T-cells (blue) with primary human CD4+ (green) and mouse CD4+ T-cells (red) (***P<0.0001) but not between primary human CD4+ and mouse CD4+ T-cells (NS, P>0.9). (E) Analysis of the lamellipodial leading edge curvature for both primary mouse CD4+ and Jurkat CD4+ T-cells after contact with the activating SLB. Quantitative differences were observed when comparing Jurkat CD4+ T-cells (blue) with primary mouse CD4+ T-cells (red); ***P<0.0001. Further details are provided in the text. All scale bars: 5 µm.

