Fig. 4.
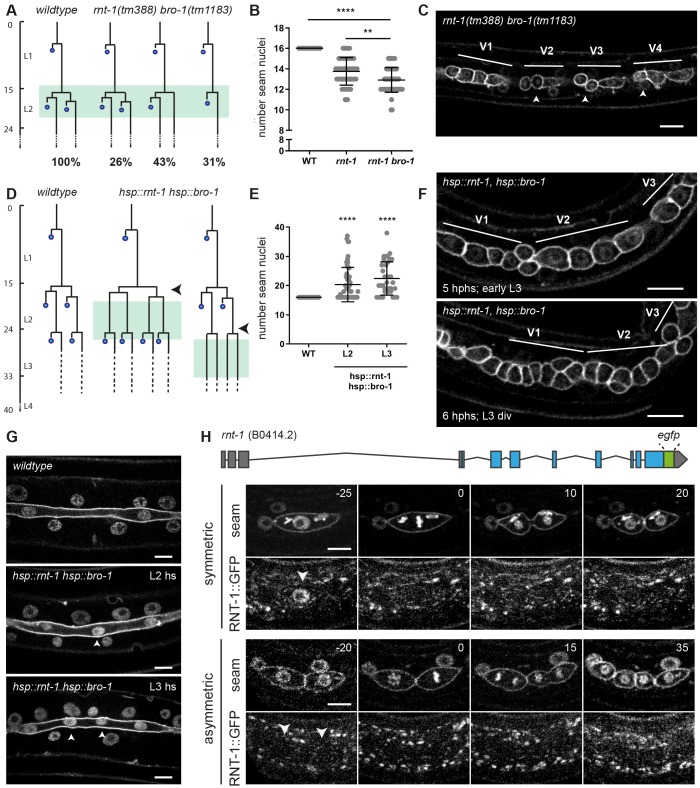
The RNT-1/BRO-1 transcriptional repressor complex promotes the seam cell fate. (A) Lineage analysis of L2 divisions of control animals and the rnt-1(tm388) bro-1(tm1183) double mutant (green box marks the time window of analysis). n=20 animals. Time (vertical) in hours post hatching. Percentage of total observed lineages is indicated for each variation. (B) Quantification of the number of seam cell nuclei at the end of L4 development for wild-type control animals, the single rnt-1(tm388) mutant and rnt-1(tm388) bro-1(tm1183) double mutant larvae. n≥40 animals. (C) Representative spinning disk confocal image of the seam cell epithelium of rnt-1(tm388) bro-1(tm1183) animals in the mid L2 stage. V1 division was normal (representing the 26% lineage in A), V2, V3 and V4 anterior daughter cells underwent the L2 asymmetric division (arrowheads), whereas the posterior cells did not (representing the 43% lineage in A). (D) Lineage analysis of control animals and heat shock-induced rnt-1 bro-1 animals. Heat shock was given between the symmetric and asymmetric division in L2 (middle; arrowhead) or before the L3 asymmetric division (right; arrowhead). Late L2 cells and L3 divisions were followed (green boxes). (E) Quantification of the number of seam nuclei at the end of L4 development for control animals and heat shock-induced L2 and L3 animals. n=40 animals for each condition. (F) Time-lapse spinning disk microscopy images of early L3 animals that underwent heat shock induction of rnt-1 bro-1 at t=17.30-18.30 h, between the symmetric and asymmetric L2 divisions. Images show epithelium 5 h after the end of heat shock (top; early L3, t=23.30 h) and 6 h after heat shock (bottom; after L3 division, t=24.30 h) during the L3 division. V1, V2 and V3 lineages were followed over time; following heat shock in L2, all anterior daughter cells behaved as seam cells in L3. (G) Spinning disk images of the seam cell syncytium in late L4 larvae that were control treated (top) or heat shock exposed (hs) during the L2 (middle) or L3 (bottom) stage to induce rnt-1 bro-1 expression. Arrowheads indicate extra nuclei in the seam syncytium. (H) Illustration of the endogenous rnt-1 gene with introduced GFP-tag (top). Time-lapse spinning disk microscopy of RNT-1::GFP and seam cell markers mCherry::PH and Cherry::H2B during L2 symmetric and asymmetric divisions (middle, bottom). Time is indicated in minutes relative to metaphase. Arrowheads indicate seam cell nuclei. **P≤0.01, ****P≤0.0001; unequal variance (Welch's) t-test. Scale bars: 10 µm.

