Fig. 5.
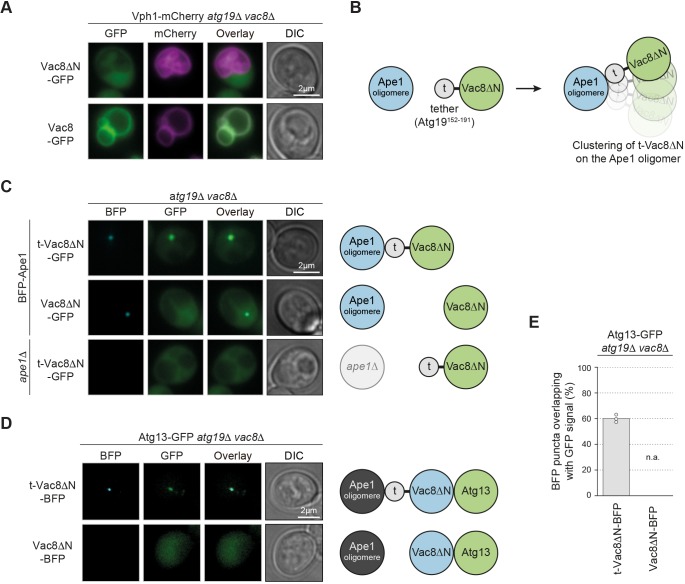
Vac8 binds to Atg13 in vivo. (A) Vph1–mCherry atg19Δvac8Δ cells carrying a plasmid expressing Vac8ΔN–GFP (Vac819-578-GFP) or Vac8–GFP were grown to mid-log phase in SD medium and starved for 1 h in SD-N medium. Representative fluorescence images are shown. (B) Schematic of the experimental setup used in (C). N-terminal truncation of 18 amino acids results in cytosolic distribution of Vac8ΔN (Vac819-578). Fusion of the Ape1-binding region of Atg19152-191 to Vac8ΔN (t-Vac8ΔN) results in ectopic localization and clustering of t-Vac8ΔN on Ape1 oligomers. (C) atg19Δvac8Δ cells carrying a plasmid expressing BFP–Ape1 and either t-Vac8ΔN–GFP or Vac8ΔN–GFP, and atg19Δvac8Δape1Δ cells carrying an empty plasmid and a plasmid expressing t-Vac8ΔN–GFP were grown to mid-log phase in SD medium and starved for 1 h in SD-N medium. Representative fluorescence images are shown. (D) Atg13–GFP atg19Δvac8Δ cells carrying a plasmid expressing t-Vac8ΔN–BFP or Vac8ΔN–BFP were grown to mid-log phase in SD medium and starved for 1 h in SD-N medium. Representative fluorescence images are shown. (E) Quantification of D. The percentage of BFP puncta overlapping with GFP signal was quantified in three independent experiments; the values of each replicate (circles) and the mean (bars) were plotted. t, tether; DIC, differential interference contrast; n.a., not applicable (none visible).

