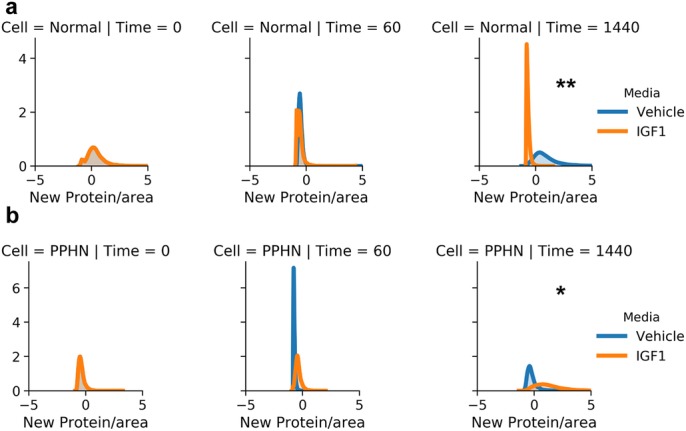
Fig. 6.

New protein synthesis in normal and PPHN PAEC. (A) Normal PAEC marginal and joint distributions of total protein production. For all cell and time snapshots, the normalized marginal probability distributions were plotted for both vehicle (blue) and IGF-1 (orange) media. (B) PPHN PAEC marginal and joint distributions of total protein production. For all cell and time snapshots, the normalized marginal probability distributions were plotted for both vehicle (blue) and IGF-1 (orange) media. All marginal distribution tests performed using the Kruskal–Wallis test. *P<0.01; **P<0.001. Non-significant test results (P>0.05) are not demarcated. Two replicates performed from different cell isolations for each normal and PPHN PAEC are presented here.
