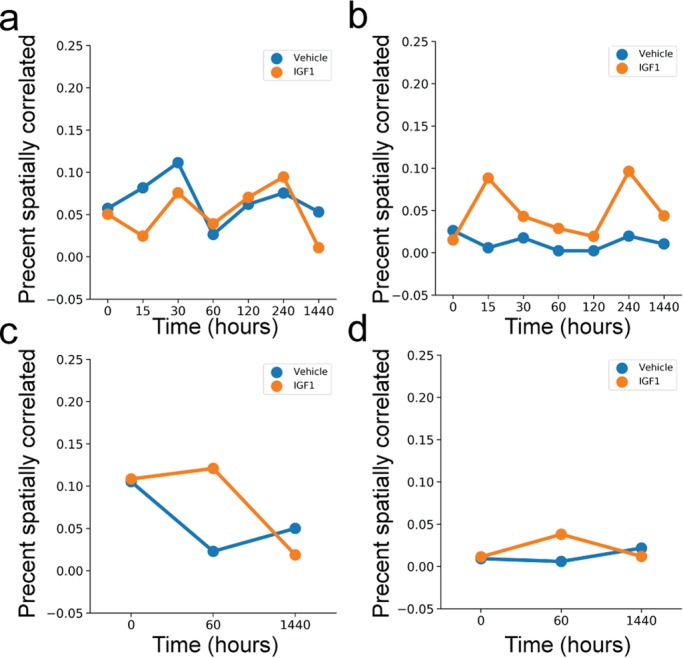
Fig. 9.

Percentage of spatially correlated PAEC in vehicle (blue) or IGF-1 (orange) media. Analysis of VEGF and eNOS immunofluorescence data for (A) normal and (B) PPHN PAEC. Analysis of total translation data for (C) normal and (D) PPHN PAEC. Two replicates performed from different cell isolations for each normal and PPHN PAEC are presented here.
