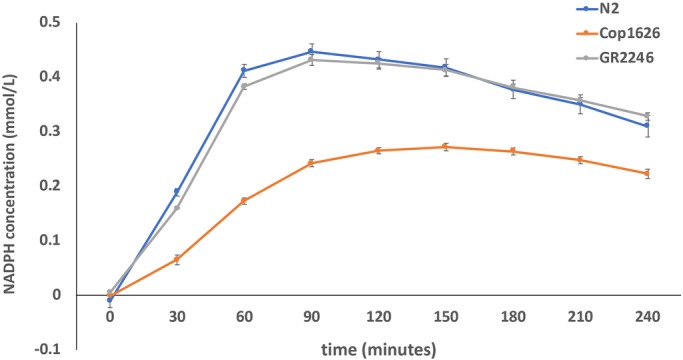
Fig. 1.

Plot of PMM2 enzymatic activity in whole-animal lysates of pmm-2F126L mutant worms. PMM2 activity is measured by production of NADPH concentration (mmol/L) over time. The blue line indicates PMM2 activity in wild-type N2 worms. The orange line indicates PMM2 activity in COP1626 worms (pmm-2F125L homozygote mutant). The gray line indicates PMM2 activity in GR2246 worms, a png-1 deletion mutant, which serves as a negative control. The same amount of protein was used in lysates from each strain.
