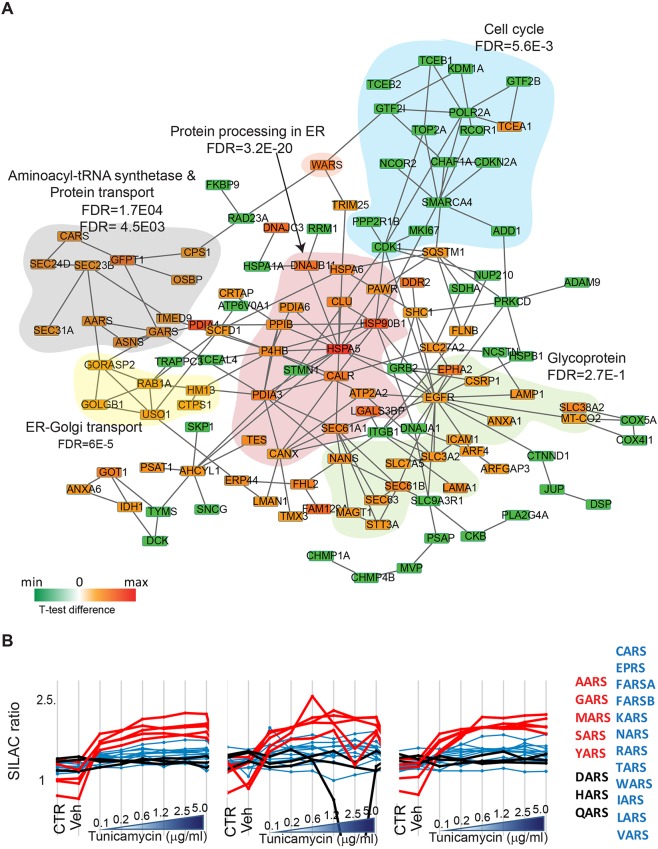
Fig. 5.
Physical interaction network of proteins significantly regulated upon tunicamycin treatment. (A) Upregulated proteins are represented in red, downregulated proteins in green according to the indicated color scale. Lines represent physical interaction. Functional subgroups are marked as colored areas. (B) Profile plots showing the coordinated expression changes of tRNA ligases upon tunicamycin-mediated UPR activation. The five tRNA ligases with the highest expression changes are indicated by red lines and font, other tRNA ligases showing increases in expression are shown in blue. tRNA ligases for which no increase in expression upon tunicamycin treatment was detected are indicated in black.

