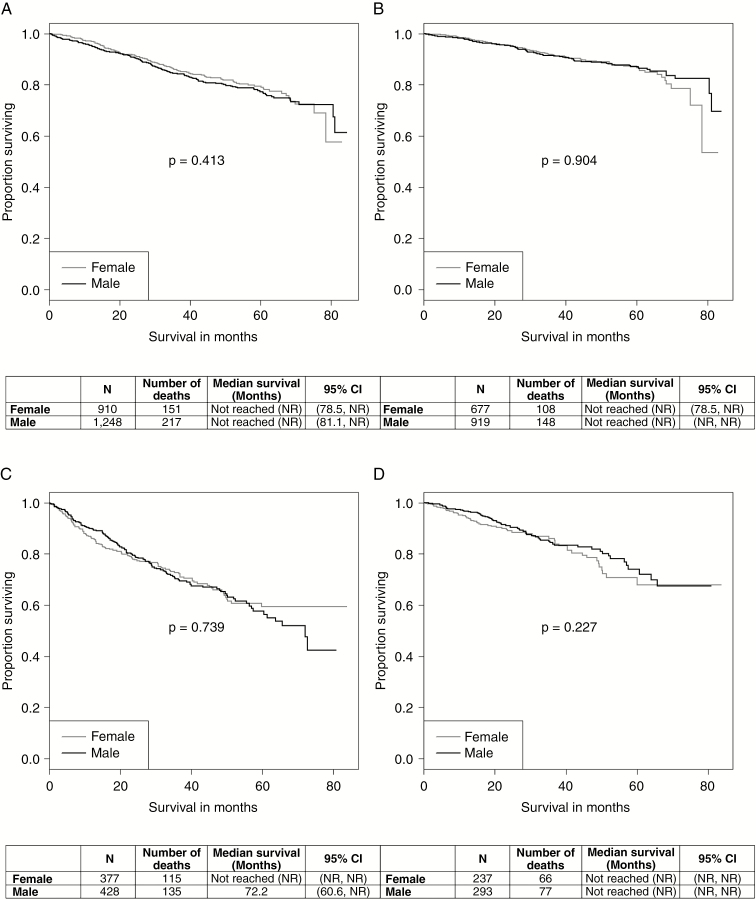
Fig. 4.
Kaplan–Meier curves for nonglioblastoma survival by sex A, unadjusted (oligodendroglioma/mixed glioma), B, adjusted for age at diagnosis, surgical resection, KPS, 1p/19q codeletion, radiotherapy, chemotherapy, primary payer, urban/rural, tumor size, and Central Brain Tumor Registry of the United States (CBTRUS) histology (oligodendroglioma/mixed glioma), C, unadjusted (astrocytoma), and D, adjusted for age at diagnosis, surgical resection, KPS, 1p/19q codeletion, radiotherapy, chemotherapy, primary payer, urban/rural, tumor size, and CBTRUS histology (astrocytoma), National Cancer Database 2010-2014.

