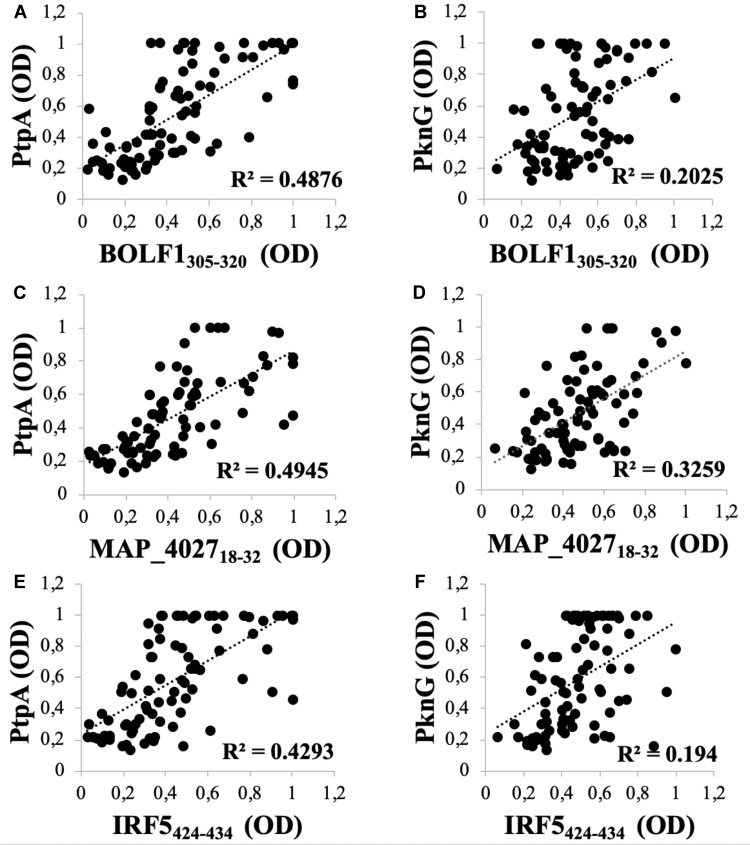
Figure 2.
Scatter plot showing correlations between Abs titers recognizing (A) BOLF1305–320 and PtpA, (C) MAP_402718–32 and PtpA, (E) IRF5424–434 and PtpA, (B) BOLF1305–320 and PknG, (D) MAP_402718–32 and PknG, (F) IRF5424–434 and PknG in 84 RA patients and 79 HCs. Person’s correlation was calculated through Graphpad Prism 6.0 software.

